Systems thinking has been described as a language for talking about the complex, interdependent issues managers face every day. Within that framework, causal loop diagrams can be thought of as sentences that are constructed by identifying the key variables in a system (the “nouns”) and indicating the causal relationships between them via links (the “verbs”). By linking together several loops, you can create a concise story about a particular problem or issue.
A causal loop diagram consists of four basic elements: the variables, the links between them, the signs on the links (which show how the variables are interconnected), and the sign of the loop (which shows what type of behavior the system will produce). By representing a problem or issue from a causal perspective, you can become more aware of the structural forces that produce puzzling behavior.
By linking together several loops, you can create a concise story about a particular problem or issue.
Take the example of an HR team that has been responsible for integrating a Total Quality approach in an organization. In the beginning, there was much enthusiasm around the program, and demand for training was high. There were also some well-publicized successes in several local line teams. But over time, the TQM programs seemed to produce diminishing results, and interest in TQM activities slacked. What happened?
1. Create Variable Names
The first step in creating a causal “story” is to identify the nouns—or variables—that are important to the issue. Remember, a variable is something that can vary over time. In the TQM example, “TQM Activities” and demand for TQM Training” are important elements of the story. Upon further conversation, the team also agreed that the “Perceived Threat” of the new program was an important element, as was the “Resistance by Middle Managers” and their willingness to change.
2. Draw the Links
Once you have identified the variables, the next step is to fill in the “verbs,” by linking the variables together and determining how one variable affects the other. In the language of systems thinking, links are labeled with either an “s” or an “o.”
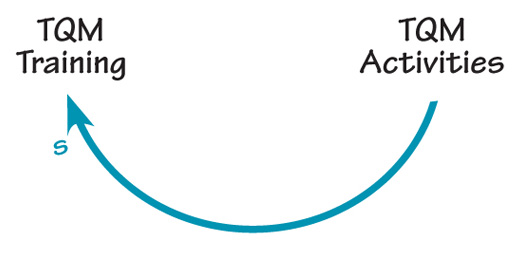
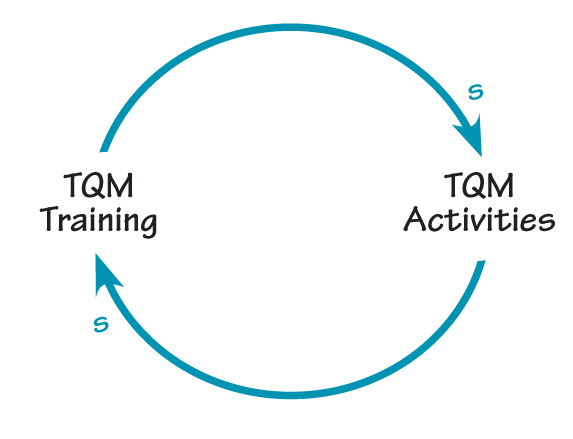
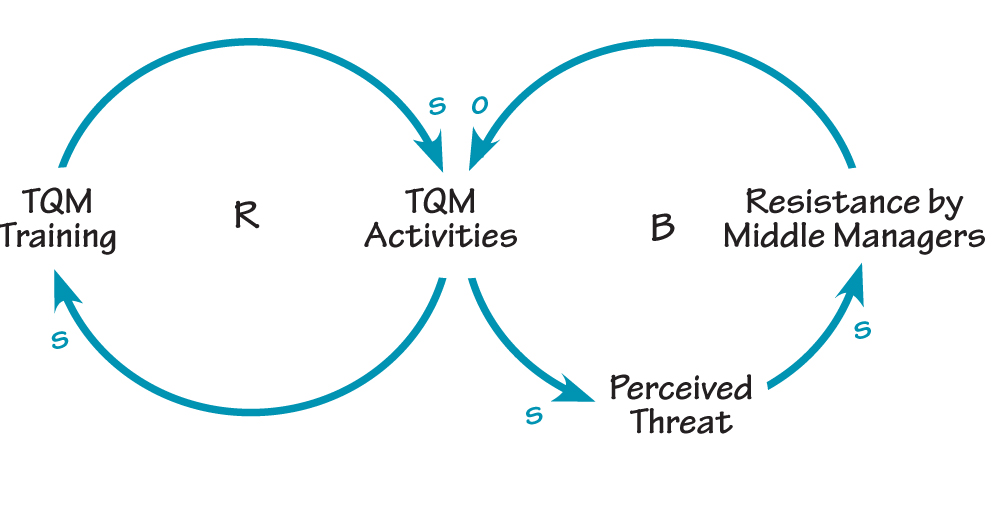
If variable B moves in the same direction as variable A, the link from variable A to B would be labeled with an “s”(or “+”). In the TQM story, the team noticed that in the beginning, TQM activities generated demand for TQM training—as activities went up, training went up (indicated by an “s” link). Similarly, as training increased, it generated even more TQM activities—another “s” link.
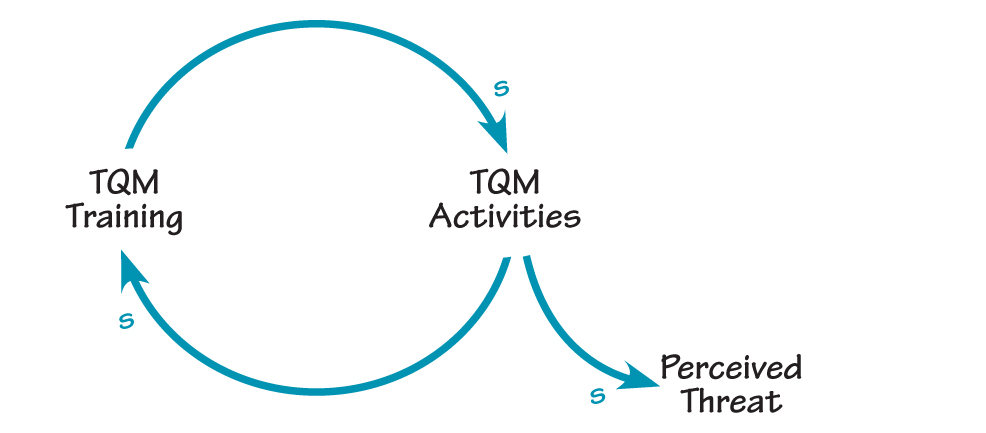
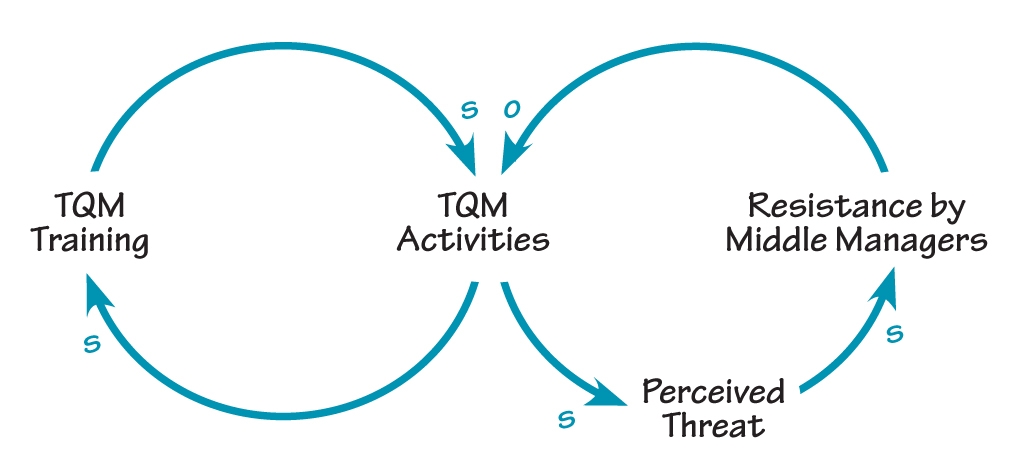
However, as TQM activities increased, the perceived threat of these activities also increased (another “s” link), which led to resistance by middle managers (another “s” link).
If variable B changes in a direction opposite of A (i.e., as A increases, B decreases), the link from A to B should be labeled with an “o” (or “-“). For example, the HR team noticed that, as the resistance by middle managers increased, the number of TQM activities decreased, which would be indicated by an “o.”
At this point, the causal “story” consists of two causal loops that are linked through the common variable “TQM Activities.”
3. Label the Loop
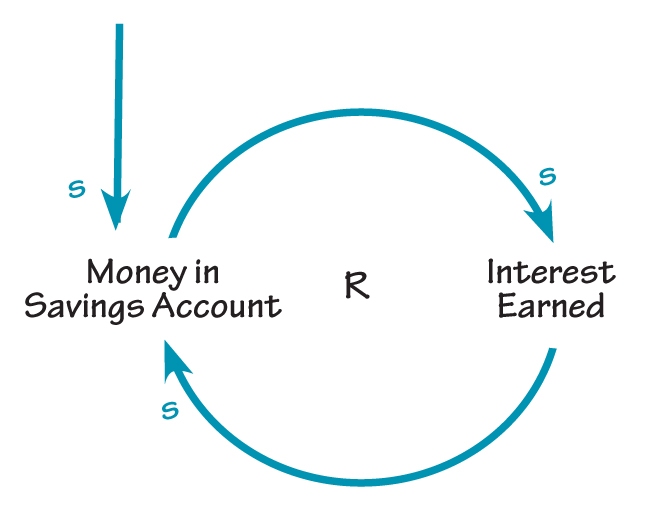
Once you have completed all of the links in the loop, you want to determine what type of behavior it will produce. In systems thinking, there are two basic types of causal loops: reinforcing and balancing. In a reinforcing loop, change in one direction is compounded by more change. For example, money in a savings account generates interest, which increases the balance in the savings account and earns more interest.
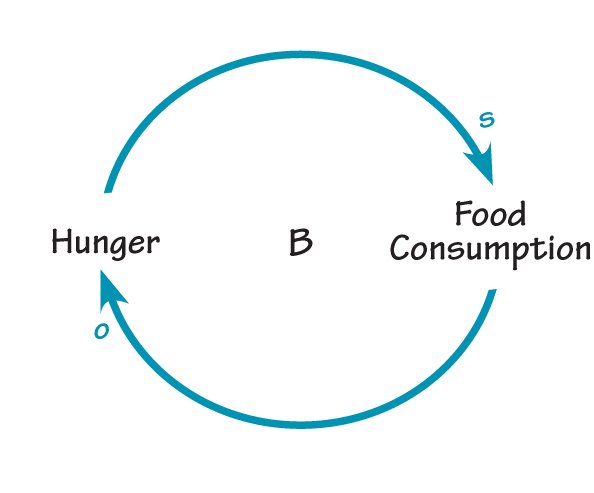
Balancing loops, in contrast, counter change in one direction with change in the opposite direction. Balancing processes attempt to bring things to a desired state and keep them there, much as a thermostat regulates the temperature in a house. For example, when we are hungry, our body sends a signal to our brain that it’s time to eat, which appeases the hunger.
To determine if a loop is reinforcing or balancing, one quick method is to count the number of “o’s.” If there are an even number of “o’s” (or none are present), the loop is reinforcing. If there are an odd number of “o’s,” it is a balancing loop. You should always double-check this method by walking through the loop to make sure the links are labeled correctly. In the TQM story, the “TQM Training” loop (which has two “s” links) is a reinforcing loop (labeled with an “R”), while the “Resistance by Middle Managers” loop (which has one “o” link) describes a balancing process that seeks to “balance” the growth in TQM activities (labeled with a “B”).
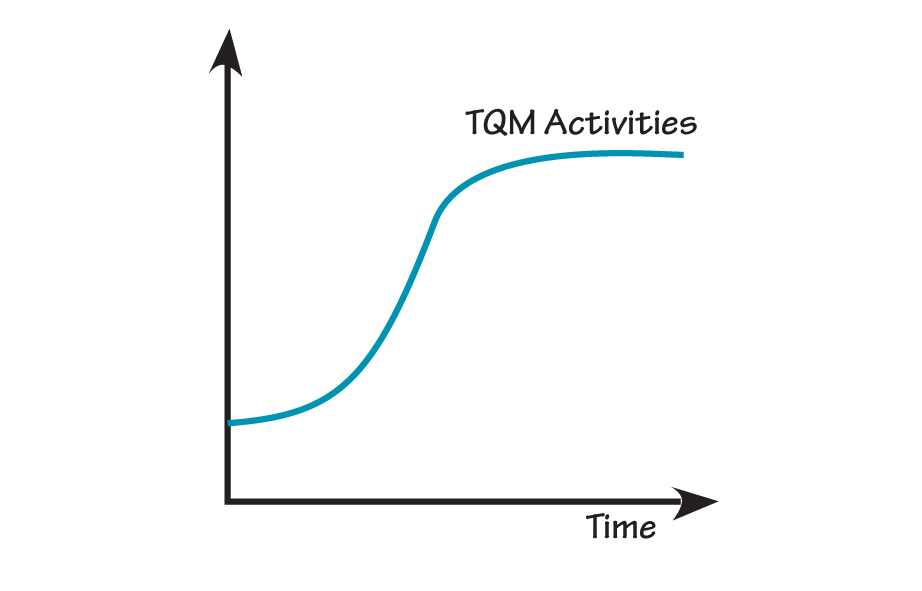
TIP: Another way to double-check the expected type of loop is to draw the behavior of the system over time. A reinforcing loop shows exponential growth (or decay); a balancing loop tends to produce oscillation or movement toward equilibrium.
4. Talk Through the Loop
Once you have completed the causal loop diagram, it is wise to walk through the loops and “tell the story,” to be sure the loops capture the behavior being described. In the TQM example, the loops tell the following story: “Initial TQM activities led to an increase in TQM training, which led to more TQM activities throughout the company. However, as the number of activities increased, the perceived threat also increased, which led to increased resistance by middle managers, and a decrease in overall TQM activities.”
Storytelling
By using causal loop diagrams to create stories about complex issues, we can make our understanding of the interrelationships within a system’s structure more explicit. The resulting diagrams also provide a visual representation that can be used to communicate that understanding with others. With practice, we can become more adept at telling systems stories that help us recognize the multiple, interdependent effects of our actions.
Colleen P. Lannon is co-founder of Pegasus Communications, Inc.