The topics elementary- and middle-school students today study are complex and often difficult to understand. Seldom is an issue as simple as it appears on the surface. And seldom will an issue present black and white choices. More often than not, students struggle with the gray areas in between two extremes, such as:
- Are the possible ecological dangers of pesticides worth the potential benefits of increased crop yields and lower disease rates?
- Is an aggressive foreign policy a deterrent to belligerent nations or will it create a more fertile atmosphere for war?
- In a novel, can we analyze the protagonist’s actions from more than one viewpoint?
Connection circles are thinking tools designed to help students understand complexity. Using them as graphic organizers, students generate ideas about changing conditions within a system. They choose the elements they think are most important to the change and draw arrows to trace cause-and-effect relationships. In this way, connection circles help students delve into an issue and manage a number of different ideas at once.
Connection circles are an intermediate step to creating causal loop diagrams (CLD). Students often don’t know where to start in creating a CLD. Connection circles let them generate ideas about elements and connections first. Then, they can unravel the feedback loops that drive the changes in the story.
How They Work
In this article, we demonstrate how to use connection circles to understand a magazine article about the health risks associated with rising french-fry consumption (, “Eyes on the Fries” by Rene Ebersole, Current Science, March 1, 2002).
1. Choose a story. It may be a newspaper or magazine article, a book chapter, or a work of fiction. The more change over time that occurs in the story, the more effective the connection circle will be.
2. Simplify the article. Although connection circles allow students to understand complex articles, vocabulary and content could still be beyond the readers’ range. In addition, a piece of writing may include a level of detail that distracts students from the big ideas and themes. Briefly discuss the central problem in the article.
3. Create teams of four students each. Although this format is not necessary, we have found that collaborative conversations improve students’ thinking. Ask students to read the article— independently, shared orally in groups, or aloud as a class.
4. Give each student a copy of the connection circle template (a circle printed in the middle of a piece of 8 1/2˝ x 11˝ paper) and briefly explain the first step of the “Connection Circle Rules.”
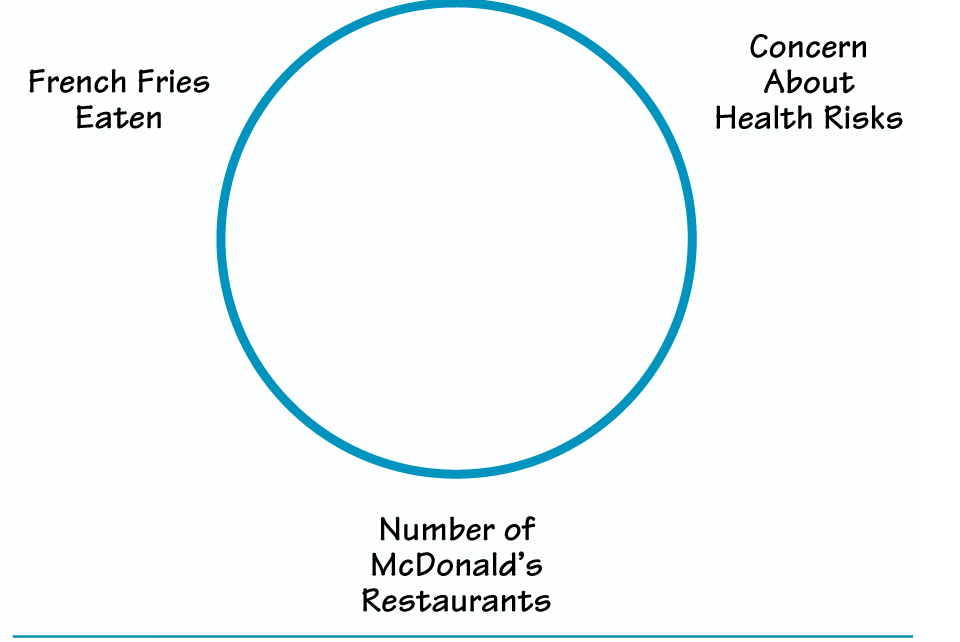
5. As a class, brainstorm two or three elements, and ask students to write them around the outside of their connection circles. Draw a connection circle on the board or overhead to use as a class example (see “Sample Circle”).
SAMPLE CIRCLE
CONNECTION CIRCLE RULES
- Choose elements of the story that satisfy all of these criteria:
- They are important to the changes in the story.
- They are nouns or noun phrases.
- They increase or decrease in the story.
- Write your elements around the circle. Include no more than 5 to 10.
- Find elements that cause another element to increase or decrease.
- Draw an arrow from the cause to the effect.
- The causal connection must be direct.
- Look for feedback loops.
Throughout the lesson, guide the discussion to ensure that students are specific in their language and that they describe either some sort of change or something that can change., “French Fries” figure prominently in the story, but that label is too vague. A more useful label to show the change in quantity might be “French Fries Sold” or “French Fries Eaten.” Similarly, “McDonald’s” is a major topic of the article, but what quantity about McDonald’s might increase or decrease? Phrases such as “Number of McDonald’s Restaurants” and “McDonald’s Profits” might more accurately describe factors in the story that can shift over time.
Also remind students that elements may be tangible, such as “Number of Restaurants,” or intangible, such as “Concerns About Health Risks” or “Desire to Change the Law.” Often intangible elements are key to the changes in the story.
7. Ask volunteers from each team to suggest elements for the sample class circle. Students may add or delete elements from their circles as they hear others’ ideas. Although the class may suggest and discuss many different elements, the final circles should have no more than five to 10 elements.
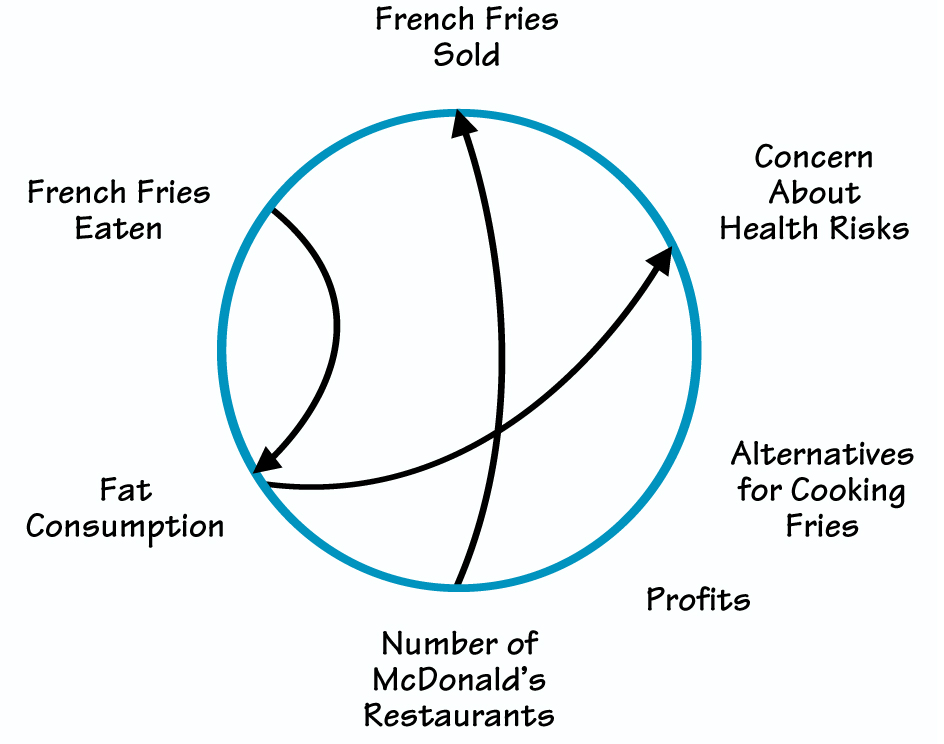
8. Ask a volunteer to describe a causal connection between two of the elements around his or her connection circle.
- Does an increase or decrease in one of the elements cause an increase or decrease in one of the others? For example, as the number of french fries eaten goes up, it causes the fat consumption to go up as well.
- To represent this statement, draw an arrow from “Number of French Fries Eaten” to “Fat Consumption,” as shown in “Connecting Elements.”
Here are two other possible connections:
- An increase in fat consumption can cause an increase in concerns about health risks.An increase in the number of McDonald’s restaurants will likely cause an increase in french fries sold.
9. Let students work in teams to connect the elements in their connection circles.
- Emphasize that elements are not limited to one connection and that some elements may not have any connections.
- Students should be prepared to state explicitly how and why the connections work. For example, in our sample connection circle, an arrow leads from “Fat Consumption” to “Concerns About Health Risks.” The reasoning is that an increase in fat in a person’s diet causes an increase in susceptibility to higher levels of cholesterol, obesity, and other conditions detrimental to well being.
10. Ask students to search their circles for paths that make a closed loop. In other words, can they begin at one element of the circle, follow connecting arrows to other elements, and end up back at their starting point, as shown in “Closing the Loop.” Students should trace each loop in a different color.
Ask students to draw each closed loop separately and tell the story of that loop. For example, an increase in the number of french fries sold causes an increase in profits. The corporation can then use those profits to open more restaurants. An increase in restaurants causes an increase in french fries sold, and the loop begins again, reinforcing itself each time around.
11. Distribute a blank overhead transparency sheet to each team. Assign one student in each group to draw a feedback loop on the sheet to share with the class.
CONNECTING ELEMENTS
CLOSING THE LOOP
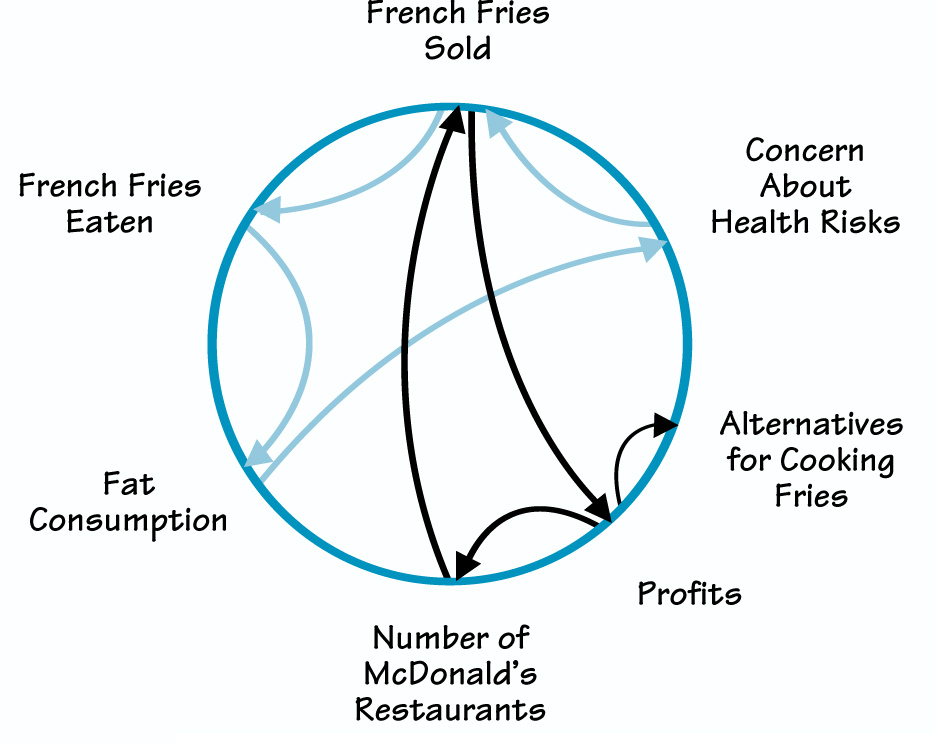
So, an increase in “French Fries Sold” causes an increase in “French Fries Eaten” and, in turn, “Fat Consumption.” Higher fat consumption can lead to a rise in concerns about health. When concerns grow sufficiently, the sale of fries may decrease, as customers try to eat healthier foods. Continuing around the loop again, a decline in “French Fries Sold” means that fewer are eaten and consequently a drop in “Fat Consumption.” A drop in fat consumption decreases “Health Concerns.” With fewer health concerns, over time, “French Fries Sold” might increase, sending the loop around again.
This feedback loop is self-balancing. Tracing around the loop, an initial increase in one element eventually comes back to cause a decrease in that element, balancing back and forth each time around the loop.
12. When the work of each team is displayed, challenge students to discover loops that share a common element. In our sample connection circle, “French Fries Sold” appears in at least two feedback loops. As students talk their way around the loops, they describe the changing behaviors of the elements in the story.
Bringing the Lesson Home
Students like using connection circles to figure things out. The tool may appear complicated at first, but after one class demonstration, students are usually ready and able to use it in a wide range of applications. Here are some questions to help guide the discovery process:
- Which elements have lots of arrows going in and out? Why? An element with lots of arrows in and out tends to be a leverage point in the story. Because of all their connections, key elements create lots of changes. In a connection circle about “Eyes on the Fries,”, “French Fries Sold” might have lots of arrows going in and out because it drives the key issues raised in the article.
- What is the significance of an element that has no arrows pointing to it? When an element has no arrows pointing to it, it is not being changed by any other element represented in the circle. If it is important, the student may need to add another variable that causes the first variable to change.
- What is the significance of an element that has no arrows coming from it? No arrows out means that the element doesn’t influence anything that is currently in the circle. The student may need to add one or more new elements.
- What is the significance of an element with no arrows connected to or from it? No arrows at all means the element is not critical to the part of the story being traced, or other elements have been omitted that need to be included.
- What does it mean when a pathway of arrows leads back to the starting element? When a pathway of arrows loops back to the original element, there is feedback in the story. Each closed loop identified is a feedback loop. When one element in the loop changes, the effect ripples through the whole loop, eventually affecting the original element as well.
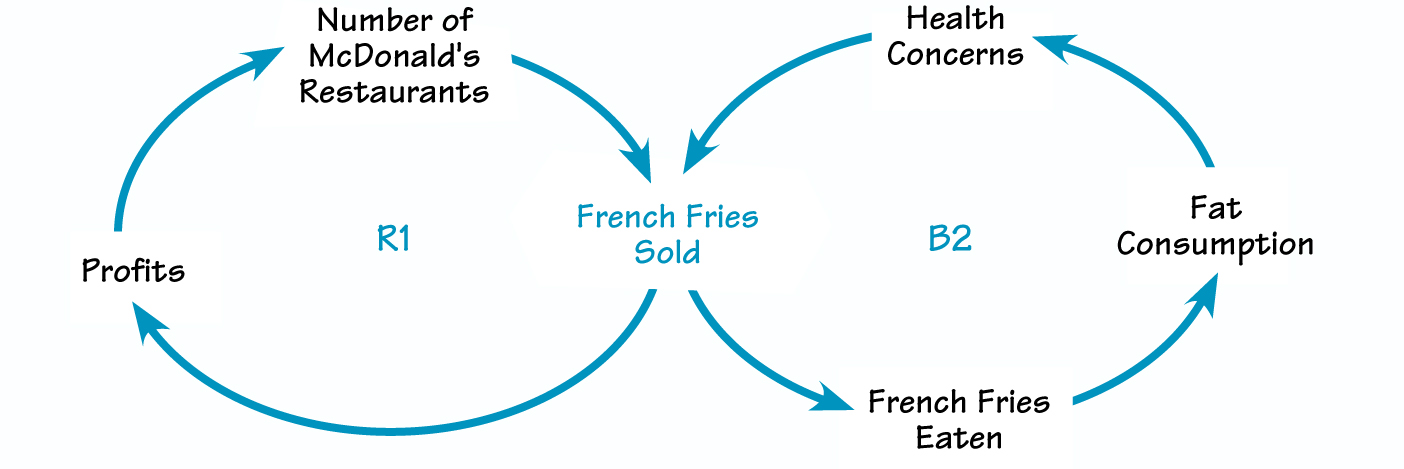
For example, in R1 of “Reinforcing and Balancing Loops,” as the “Number of McDonald’s Restaurants” goes up, “French Fries Sold” also goes up, causing “Profits” to rise. Higher profits tend to increase the number of restaurants being opened, starting the process again. This is a reinforcing loop, commonly known as a vicious or virtuous cycle.
Another kind of feedback loop is a balancing loop. In contrast to a vicious cycle, a balancing loop does not spiral in the same direction, but rather see-saws back and forth. For example, in B2 of “Reinforcing and Balancing Loops,”, “French Fries Sold” increases “French Fries Eaten,”, “Fat Consumption,” and, ultimately, “Health Concerns.” If health concerns grow strong enough, french fry sales will be driven down.
Follow the loop around a second time and notice what happens to the elements. When health concerns grow, the number of french fries sold and eaten go down. Fat consumption is reduced, and eventually health concerns should lessen. Over time, with fewer health concerns, people might start to buy more french fries again.
- What happens when elements from the connection circle are in more than one feedback loop? The loops will interact in ways that make the behavior interesting and often quite complex! As demonstrated in the previous paragraph, the sale of french fries creates profits but also creates health concerns. Profits increase the number of restaurants, and more restaurants mean more french fries sold. But health concerns tend to reduce the number of french fries sold. The loops push in different directions, causing tension and complexity in the story.
The goal of using this tool isn’t to find one specific connection circle that will correctly describe a given topic or article. Rather, the circle is designed to generate ideas and to clarify thinking about complex issues.
Connection circles help us brainstorm about what is changing and trace webs of relationships within systems to understand those changes. The connection circle examples in this story demonstrate one way to interpret “Eyes on the Fries,” but they are not the only way.
Teachers and students will be happy that thinking, not memorizing, is the key to learning from this activity. Try creating connection circles and watch your students start paying attention to the shape of change.
REINFORCING AND BALANCING LOOPS
This article is adapted from a chapter in The Shape of Change (Creative Learning Exchange, 2004), by Rob Quaden and Alan Ticotsky, with Debra Lyneis. Illustrations by Nathan Walker. For information about or to purchase the book, go to http://www.clexchange.org/shapeofchange/ or to http://www.pegasuscom.com.
Rob Quaden and Alan Ticotsky are teachers in the Carlisle Public Schools in Carlisle, Massachusetts. Quaden is an eighth-grade algebra teacher and Carlisle’s math curriculum coordinator. Ticotsky is Carlisle’s science curriculum coordinator and a former elementary classroom teacher. Deb Lyneis works at the Creative Learning Exchange, helping teachers publish their system dynamics curriculum material for other teachers to use.