Making mental models explicit can enhance both individual and organizational learning by making individual learning more accessible and therefore more easily transferable to the rest of the organization. The process of eliciting mental models through causal loop diagrams is analogous to creating a story. A good story helps us make sense of our world, and in that way it can serve as the beginning of an articulated theory. The process outlined below offers a step-by-step guide for creating a causal representation of a mental model.
1. Select the Issue
The first step in making mental models explicit is to identify the system or event to be investigated and collect the appropriate data. It is often helpful to look for a significant problem that has persisted despite efforts to eliminate it, or one that is present in a variety of organizational settings and is therefore difficult to define.
For example, in one company, senior management had charged a group of managers with implementing TQM by forming a Quality Improvement Team (QIT). In principle, the QIT team understood the long-term business implications of investing in TQM, but the many daily demands on their time often kept them more focused on meeting their nonTQM responsibilities. Over time, a group norm developed that it was okay not to prepare for the meetings or to be interrupted when doing TQM work, and attendance at TQM meetings began to decline.
2. Force-Field Analysis
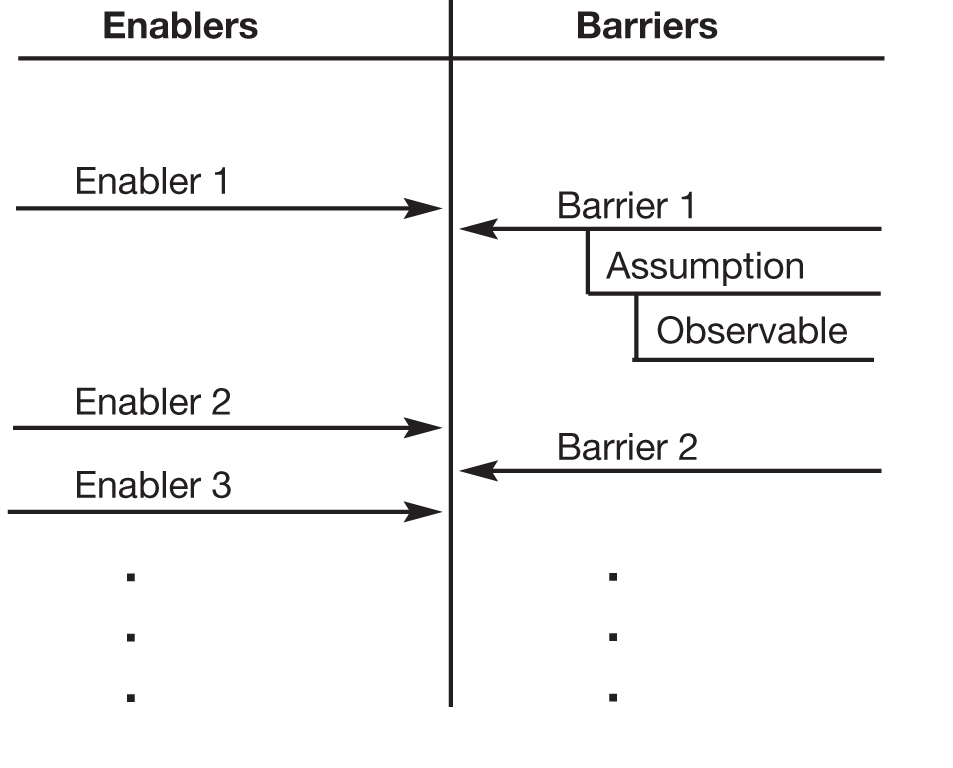
DEEP FORCE-FIELD ANALYSIS TEMPLATE

A force-field diagram provides deeper understanding of an issue by identifying those things that enable or hinder an objective and the assumptions behind those factors.
The next step in making individual mental models explicit is to conduct semi-structured interviews with people closely involved with the issue. This begins to engage people in the process of making their thinking explicit. In the interviews, ask people to:
- trace the chronology of significant events,
- clarify their role in the situation,
- do a modified force-field analysis of the situation.
Conducting a deep force-field analysis requires: (1) identifying factors that are seen as barriers and enablers to achieving the objective, (2) making explicit the assumptions behind each barrier and enabler, and (3) providing directly observable examples that illustrate each one (see “Deep Force-Field Analysis Template”). The interview data may need to be augmented or clarified with company records or other data sources.
3. Select Important Variables and “Scrub”
After gathering the initial round of data, the next step is to identify the variables that are mentioned frequently or those that are claimed to directly affect key performance measures. In the TQM example, relevant variables might include “Senior Management Attention” “TQM Importance,” “TQM Activity,” and “Event-Driven Activity.”
When extracting data from the interviews, watch for subjective wording of variables such as “poor management” or “unmotivated workers.” Avoid such subjectivity by making sure to “scrub” the verbal data—that is, strip away qualifying adjectives and remove any judgment or inference.
4. Describe Variable Relationships
The next step is to identify other variables that are directly linked to each significant variable. Try to find as many interconnected pairs as possible by looking for causes, consequences, and constraints that link variables together. For example, in our TQM story, we can link the variable “Sr. Management Attention,” to “TQM Importance” with an “s” (indicating change in the same direction) since the managers tried to raise the importance of TQM by launching a QIT. These “directed arc” pairs will become the building blocks for the causal structure of the story.
5. Name and Describe the Story
To begin developing causal loops from directed arc fragments, it helps to identify a common “story” that runs through several fragments. The story helps guide the construction process by providing a theme against which we can judge whether or not to include a particular fragment. These stories should be recurring or systemic in nature, containing feedback characteristics (as opposed to one-time events which tend to be linear).
In the TQM example, we could tell a story entitled “Directive without Commitment” to describe the dynamics of the group. The QIT effort failed due to a lack of commitment by those who were responsible for launching the activity. In their view, QIT activities took a “back seat” to more pressing daily demands.
6. Construct a Causal Loop
To begin structuring the story, start linking relevant fragments together in the form of a causal loop diagram. Use questions such as, “Why did this happen?” to uncover further upstream causality, and “What did this affect?” to determine further downstream causality. Continue to link the elements in a feedback or causal loop structure until the causal loop reflects the story being told. Be sure to insert delays between cause and effect where appropriate.
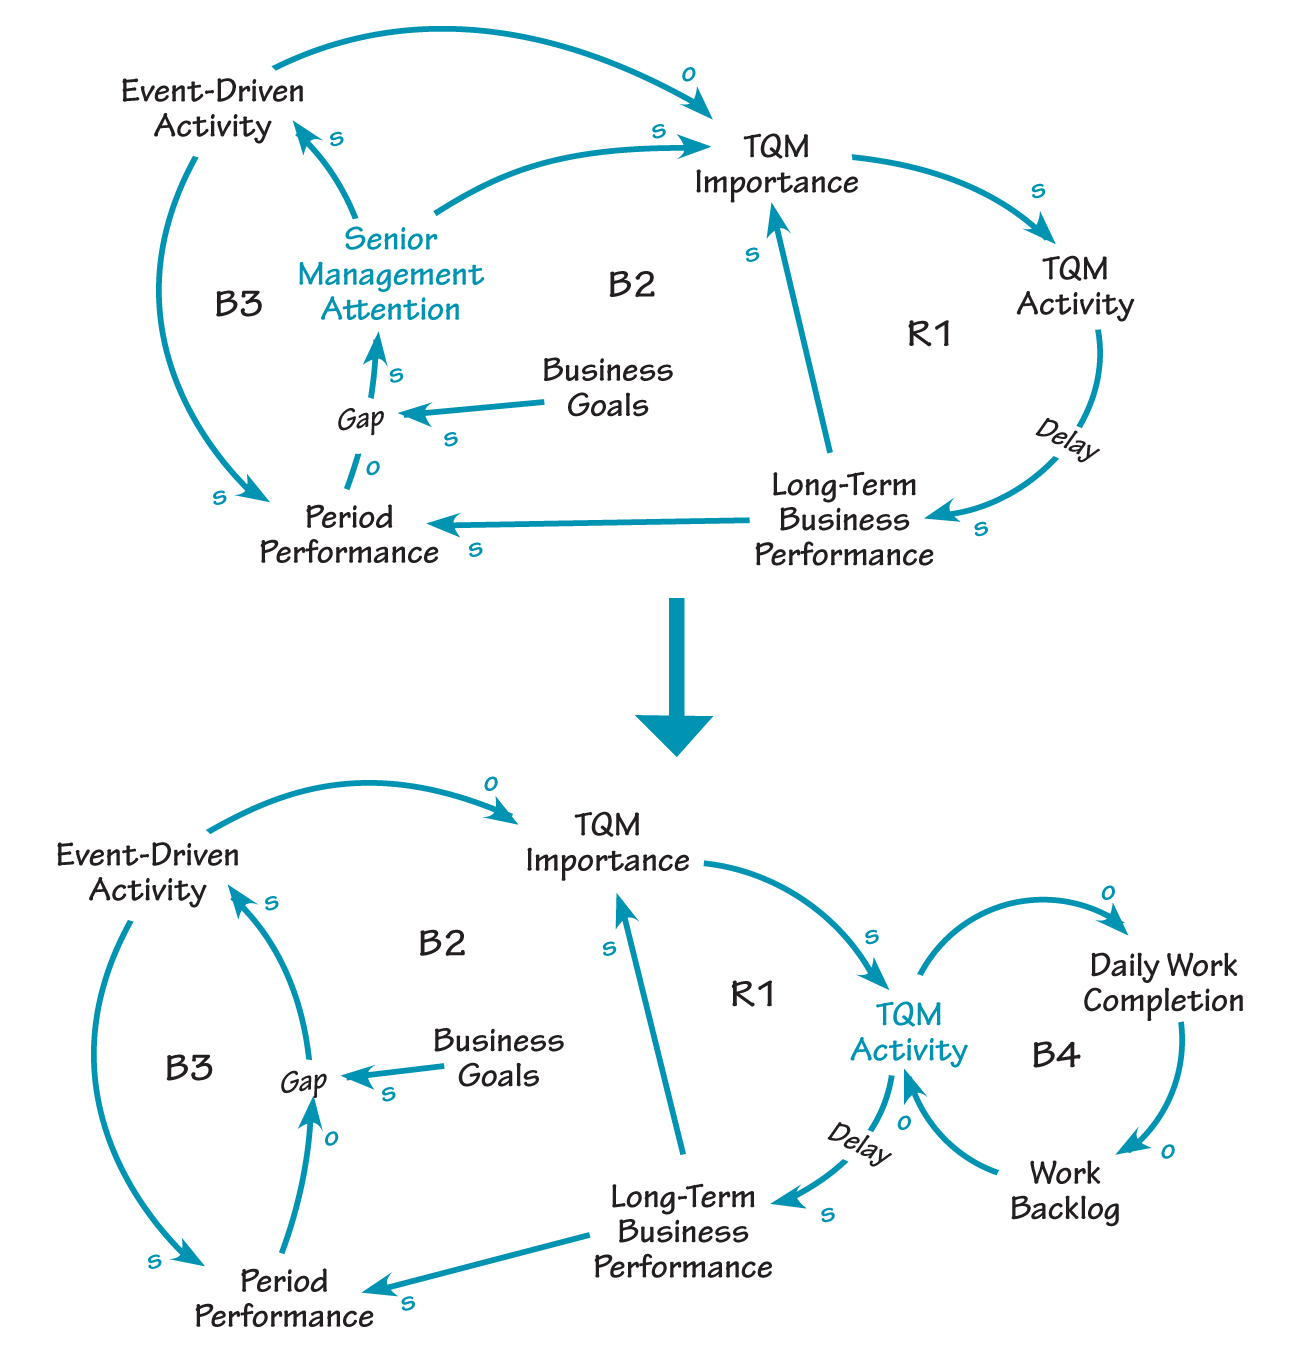
CONFLICTING PRIORITIES

The first causal loop diagram (top) describes the belief by senior management that awareness of the importance of TQM would increase TQM activity (R1). However, they were also focused on event-driven activities that would reduce a gap between period performance and overall business goals (B2 and B3). In the final diagram (bottom), loop B4 is added to capture the dynamics of work demands that took time away from TQM activities
In the TQM example, senior management believed that as awareness of the importance of TQM increased, TQM activity would increase. This would eventually lead to improved long-term business performance, which should further heighten the importance of TQM (loop R1 in “Conflicting Priorities”). But senior management was also concerned with making sure day-to-day activities were done. And as event-driven activity increases, it takes time away from TQM activity (as the QIT members experienced).
7. Check the Diagram with the Story
Once you have a sketch of a causal loop diagram, it is critical to check it against the story to make sure it actually describes what the story is telling. In the TQM example, this step made the group realize that the link between senior management attention and event-driven activity was not explicitly supported by the data. Be sure to make changes where appropriate to better reflect the dynamics of the story.
8. Fine-Tune the Loop Detail and Recheck the Story
To fine-tune the loop, trace the logical flow through the diagram to make sure that there are no interruptions or “leaps,” and confirm that every cause-and-effect relationship represents the logical next step in the development of the story. Then check the level of detail, or “abstraction level,” to make sure that all elements are telling the story at the same level.
In reviewing the TQM diagram from this perspective, “Senior Management Attention” should be pulled out of the loop because once they delegated the task, they were no longer part of the story. A link can be added, however, to a new variable, “Work Backlog,” to represent the pressures that accumulate whenever time is diverted from daily work. This balancing loop captures the dynamics of team members being interrupted and missing meetings when pressed by other urgent activities (B4).
If any changes result from fine-tuning the loop detail, recheck the story against the interviews to ensure that the story is still adequately represented by the causal loop diagram.
New Insights
When developing causal loop representations of mental models, we are not concerned with capturing the world “as it really is” but rather with accurately representing an individual’s beliefs or mental models of the world. This does not mean that the mapping process is simply a regurgitation of what was already known. Mapping can actually be a discovery process in which new insights are gained by structuring a person’s experience in a clear and coherent framework. And, as we will discuss next month, such maps can help build a better shared understanding of an issue.
Daniel H. Kim is co-founder of Pegasus Communications, founding publisher of The Systems Thinker newsletter, and a consultant, facilitator, teacher, and public speaker committed to helping problem-solving organizations transform into learning organizations.
