We live in an age of spreadsheets. From tracking expenses to projecting future revenue streams, spreadsheet software packages have become an invaluable tool for many corporations. But spreadsheets are of limited use when it comes to dealing with dynamic problems, where the emphasis is on the key relationships between variables. In a spreadsheet, only the numbers are visible. The relationships between those numbers — the equations — are buried behind the boxes.
Enter ithink, the latest product from High Performance Systems — the STELLA people. STELLA, which first came out in 1985, is a visual diagramming tool for creating computer models of complex issues. It was considered a breakthrough in modeling, because it turned the spreadsheet concept inside-out: the relationships arc put on top, in the form of icons which are linked together, while the numbers are stored underneath the diagram elements.
ithink is the result of High Performance Systems’ recent decision to cleave STELLA into two distinct product lines: a new version of STELLA, which is geared toward an academic audience, and ithink, the business-oriented application. ithink retains the best of STELLA while adding some new features which make it even better at capturing complex issues and testing alternative scenarios.
From ‘Mental Models’ to Computer Models
Psychologists say we can only hold six or seven thoughts in our heads at one time. But since most systems we deal with have far more components, we can’t possibly carry around an accurate picture of those systems. ithink makes it possible to capture our mental models in a diagram, literally drawing a map of the important interconnections and relationships in a system. Using its simulation capabilities, it is then possible to study the dynamics that result from those interconnections.
Visual Tool
When creating a model with ithink, managers start by capturing the “big picture” of their business. Using the “camera” icon, they can insert a picture that represents the overview structure of the problem under study — a map of key markets or suppliers, for example. This picture then opens up to reveal a fuller representation of the system in the form of a diagram of the system’s “plumbing.”
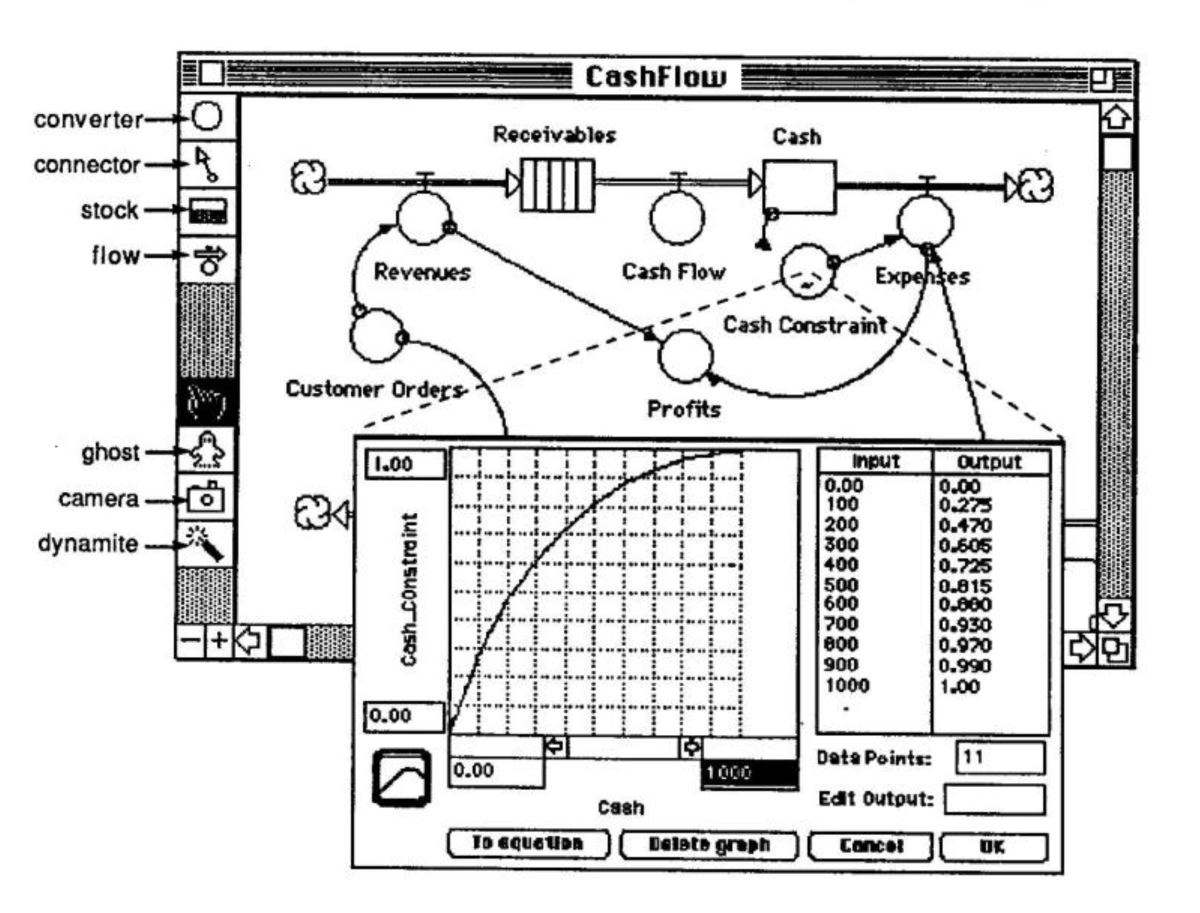
ithink’s four tools — stocks, flows, converters, and connecters — are the building blocks for creating models (see the “Cash Flow” diagram). Stocks represent things that accumulate, such as water in a bathtub or, in the Cash Flow model, cash. “Soft” values can also accumulate, such as frustration or resentment. Flows, like the faucet and drain on a bathtub, determine what flows into or out of a stock. In the cash flow model, revenues flow into receivables, while cash flow drains receivables.
Converters and connector arrows help capture other relationships in a system that are not represented by stocks and flows. For example, in the Cash Flow model, a connector arrow is used to show that cash has an effect on cash constraint (a converter), which in turn affects expenses.
Once the “plumbing” of the diagram is laid out, it is time to fill in any unspecified equations. To help with this process, ithink has over fifty macro and data import capabilities. Or, using ithink’s graphic function, you can sketch in the relationship between two variables (see the cash/cash constraint graph).
You are now ready to bring your creation to life. ithink can automatically run a simulation of your model, giving you output in the form of graphs, comparative plots, or spreadsheets. If the numbers don’t seem right, you can easily change the diagram or the equations to create a more accurate picture of the system. You can also share the model with your colleagues, expanding and refining the model as your collective understanding of the system grows. This ability to quickly sketch out and share your mental picture of a system with others makes ithink well worth its price.
Multiple Scenarios
Once you have fine-tuned the model, you can put ithink’s advanced features to work for you by testing alternative policies or locating “leverage points” — areas in a system where small change can create dramatic results.
ithink's New Features
While ithink retains the main features that made STELLA so popular, it also has some useful additions:
- The “camera” icon. The camera can be used to import maps, pictures and text. When placed on top of various sectors of the model, these graphics can give users a valuable overview of the model before they go down into the trenches to see the relationships governing a particular sector.
- Output Options. With ithink you can view output in comparative plots as well as time series and scatter plots. Sensitivity analysis can now be done automatically, and the tables have been reformatted to look more like spreadsheets.
- Adding documentation. The dialog boxes associated with the model’s variables now have a button labeled “documentation.” It opens a new field where you can write documentation for the variable.
- Seeing Feedback Loops. ithink has a new menu option labeled “show feedback.” When it is selected, only the variables involved in feedback loops will be displayed, making it easier to gain an understanding of the interconnections governing the system.
- Different Stocks. Whereas STELLA’s stocks were continuous in nature, ithink offers three additional discrete stock types: Conveyers, Queues, or Ovens. This gives you the ability to more accurately model discrete accumulations found in many real world systems.
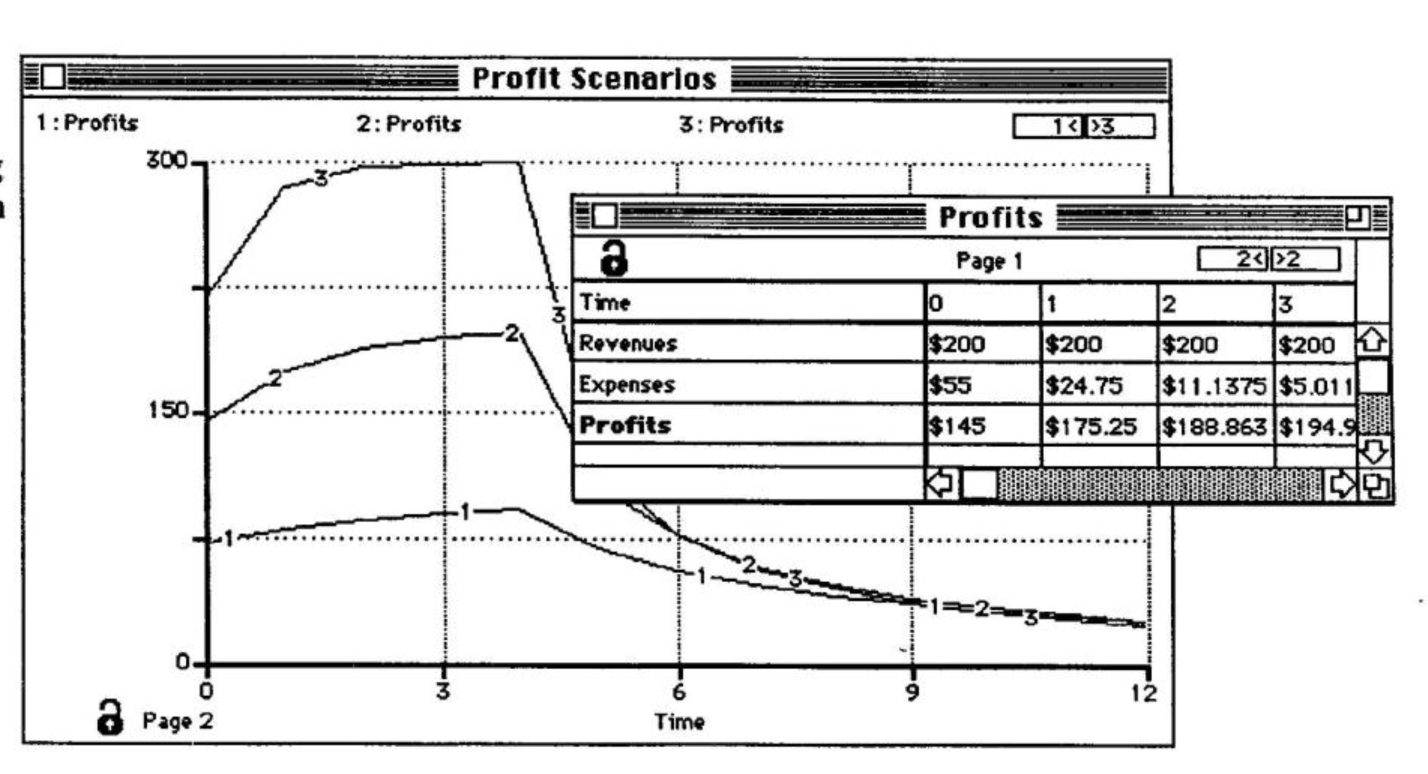
The comparative plot feature enables you to save the values of several different model runs and plot them on the same graph (see the “Profit Scenarios” graph). It is then very easy to compare the effect of different policies on key variables. Comparative plots make scenario planning even easier with ithink than STELLA — a big advantage for planning departments.
The sensitivity tools allow you to test a key variable with different values, charting its effect on other variables. Once you set the range of values, ithink automatically runs the model and displays the results on comparative plots. Using ithink’s sensitivity analysis feature, you can locate leverage points by determining which policy gives you the results you want over the long term.
ithink, like its predecessor STELLA, is an excellent tool for understanding complex systems and testing different policies within those systems. But ithink goes one step further, adding features such as sensitivity analysis and comparative plots which enhance its policy-testing capabilities. Although we may currently live in the age of spreadsheets, ithink goes a long way towards ushering in a new age of visual thinking tools.
W. Brian Kreutzer is vice president of research and development at Gould-Kreutzer Associates, Inc., Cambridge, MA. He co-authored the second edition of Managing A Nation, The Microcomputer Software Catalog, with Ors. Gerald Barney and Martha Garrett.
ithink is a product of High Performance Systems, Inc., (800) 332-1202.