In this issue’s Toolbox it may be helpful to lay out the full array of systems thinking tools from which this column draws. You can think of these tools like a painter views colors — many shades can be created out of three primary colors, but having a full range of colors ready-made makes painting much easier.
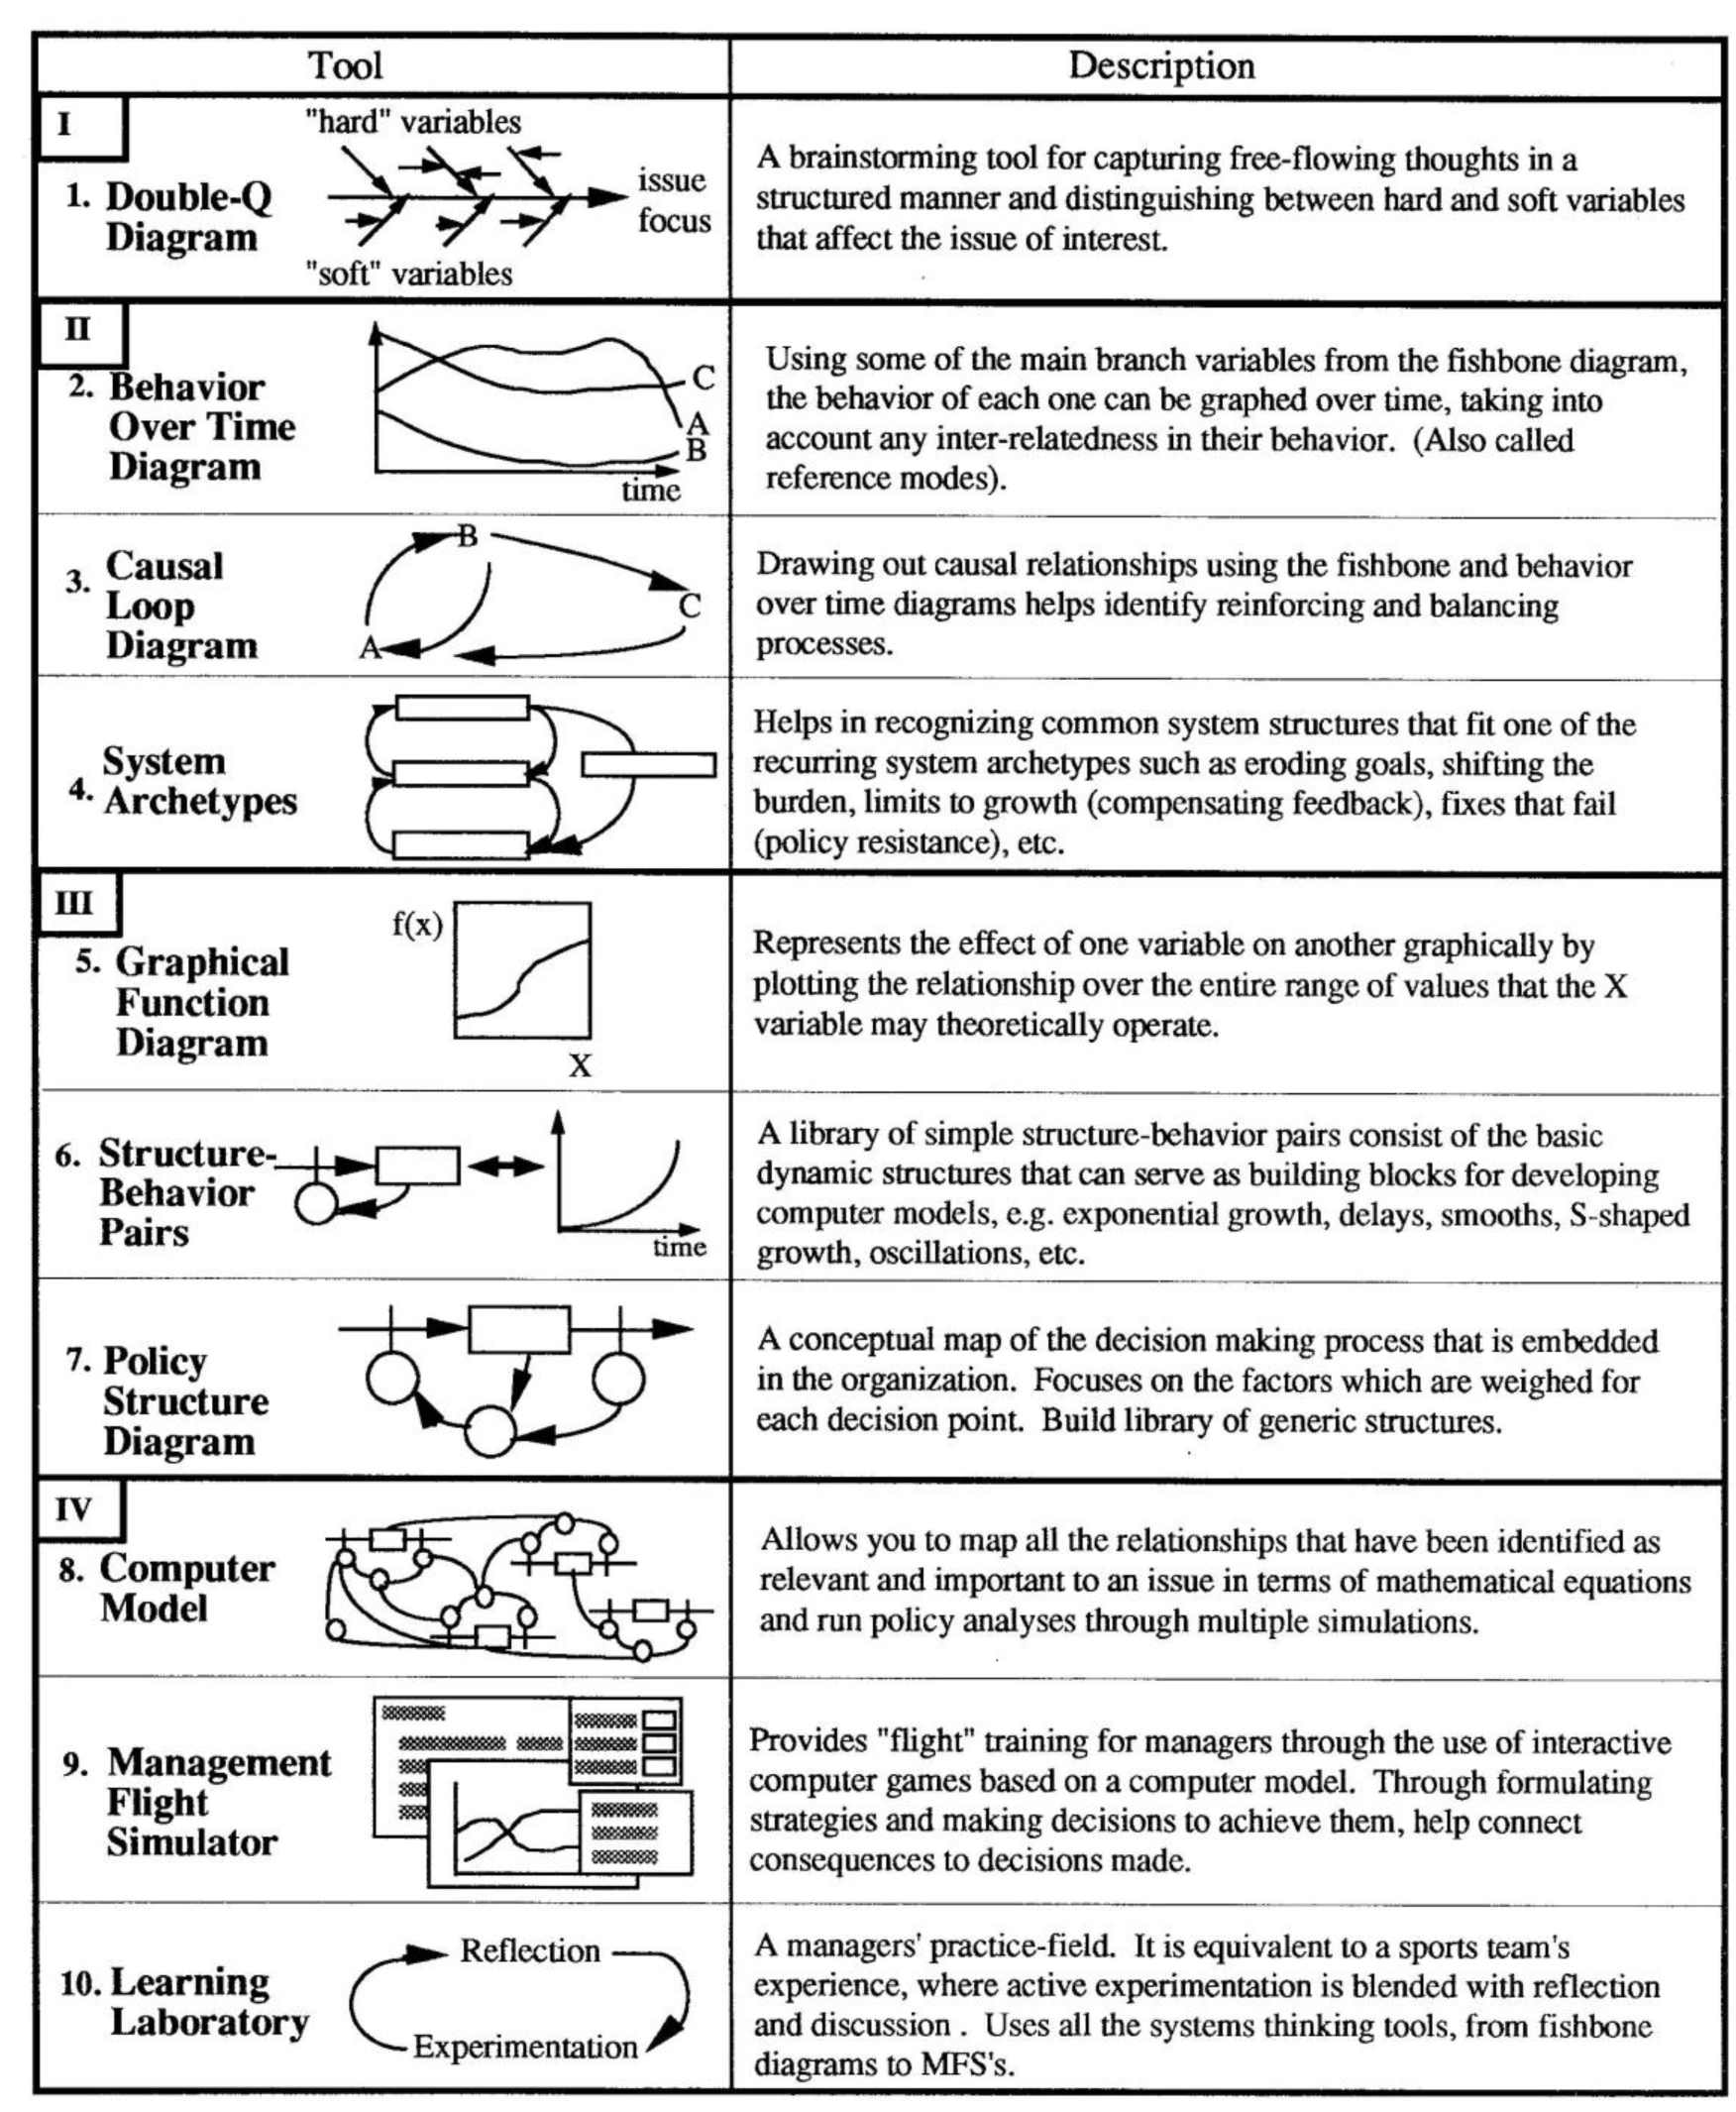
There are at least ten distinct types of systems thinking tools (a full-page summary diagram appears on the next page) which fall under four broad categories: I. Brainstorming Tools, II. Dynamic Thinking Tools, III. Structural Thinking Tools, and IV. Computer-Based Tools. Although each of the tools are designed to stand alone, they also build upon one another and can be used in combination to achieve deeper insights into dynamic behavior.
Brainstorming Tools
The Double-Q (QQ) Diagram is based on what is commonly known as a fishbone or cause-and-effect diagram. The Q’s stand for qualitative and quantitative, and the technique is designed to help participants begin to see the whole system. During a structured brainstorming session with the QQ diagram, both sides of an issue remain equally visible and properly balanced, avoiding a “top heavy” perspective. The diagram also provides a visual map of the key factors involved. Once those factors are pinpointed, Behavior Over Time Diagrams and/or Causal Loop Diagrams can be used to explore how they interact.
A QQ diagram begins with a heavy horizontal arrow that points to the issue being addressed. Major “hard” (quantitative) factors branch off along the top and “soft” (qualitative) factors run along the bottom. Arrows leading off of the major factors represent sub-factors. These sub-factors can in turn have sub sub-factors leading off of them. However, many layers of nesting may be a sign that one of the sub-factors should be turned into a major factor.
Although QQ diagramming may sound like a very rigid process, it can help give form and structure to “fuzzy” problems. It can be likened to the free flowing visualization process that an artist uses which encourages creativity while still adhering to artistic “rules.”
Dynamic Thinking Tools
Behavior Over Time (BOT) Diagram. BOT diagrams are more than simple line projections—they require an understanding of the dynamic relationships among the variables being drawn. For example, say we were trying to project the relationship between sales, inventory, and production. If sales jump 20%, production cannot jump instantaneously to the new sales number. In addition, inventory must drop below its previous level while production catches up with sales. By sketching out the behavior of different variables on the same graph, we can gain a more explicit understanding of how these variables interrelate.
Causal Loop Diagram (CLD). The Causal Loop Diagram provides a useful way to represent dynamic interrelationships. CLD’s make explicit one’s understanding of a system structure, provide a visual representation with which to communicate that understanding, and capture complex dynamics in a succinct form. CLD’s can be combined with BOT’s to form structure-behavior pairs which provide a rich framework for describing complex dynamic phenomena (see Toolbox, Vol. 1, No. 1, “Reinforcing and Balancing Loops: Building Blocks of Dynamic Systems” and Vol. 1, No. 2, “Balancing Loops with Delays: Teeter Tottering on Seesaws”). The CLD’s are the systems thinker’s equivalent of the artist’s primary colors.
System Archetypes is the name given to certain common dynamics that seem to recur in many different situations. These archetypes, consisting of various combinations of balancing and reinforcing loops, are the systems thinker’s “paint-by-numbers” set — users can take real-world examples and fit them into the appropriate archetype. Specific archetypes include: Drifting Goals, Shifting the Burden, Limits to Success, Success to the Successful, Fixes that Backfire, Tragedy of the Commons, Escalation.
Structural Thinking Tools
Graphical Function Diagrams, Structure-Behavior Pairs and Policy Structure Diagram can be viewed as the building blocks for computer models. Graphical Functions are useful for clarifying nonlinear relationships between variables. Structure-Behavior Pairs link a specific structure with its corresponding behavior. Policy Structure Diagrams represent the decision-making processes that drive policies. In a sense, when we use these tools we are moving from painting on canvas to sculpting with hammer and chisel.
Computer-Based Tools
This class of tools, including computer models, management flight simulators, and learning laboratories, demands the highest level of technical proficiency to create. On the other hand, very little advance training is required to use them once they are developed. We will discuss these tools in future issues from the perspective of predesigned packages — art appreciation versus a creation.