Making individual mental models explicit is only one step toward fostering organizationwide learning. Since perceptions of reality can vary widely among different people in the same setting, building shared mental models is critical. The process described below provides a way for a group to view their individual experiences as part of a larger system.
Step 1: Build Integrated Map
To begin creating a shared mental model, the first step is to integrate individual stories into a common map. In this step, individual causal loop diagrams that have previously been developed are combined into a central story that clearly captures the dominant theme running through most of the stories. For example, a company that implemented a TQM program had difficulty sustaining its TQM
TRAININIG CAPACITY STORY
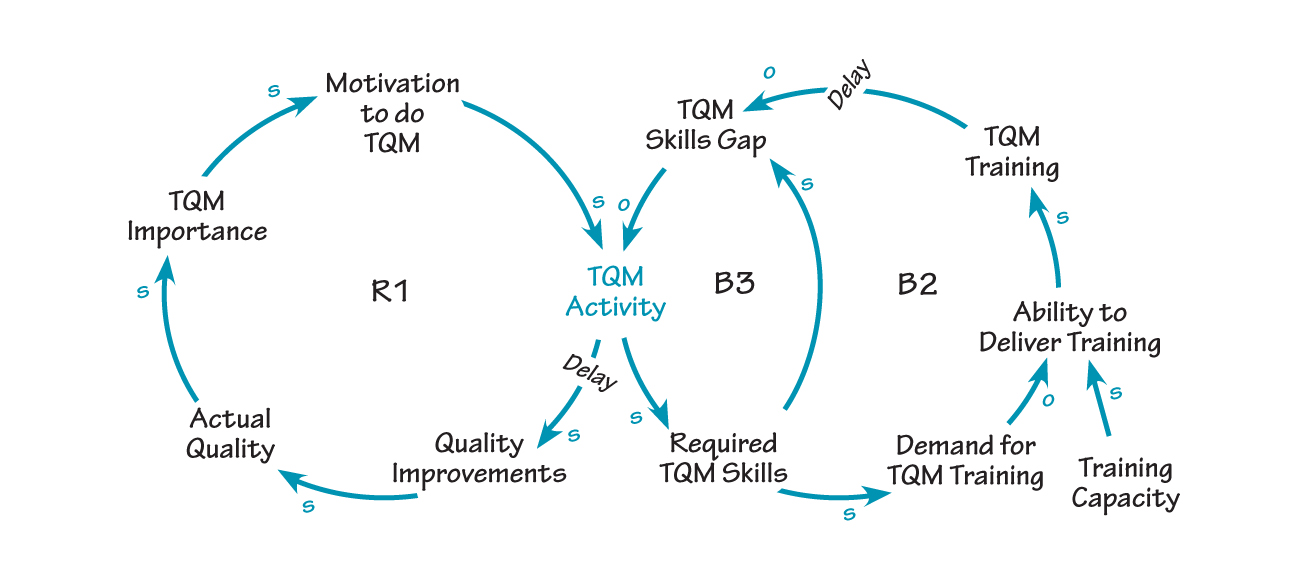
Initial TQM activity meets with success, thus increasing motivation to do more TQM activities (R1). However, if training capacity does not keep pace with the demand for training generated by the TQM activities, the TQM skill gap increases, limiting TQM activities. This dynamic traces out a “Limits to Success” archetype
activities because it required more training than was available. The main loop in this story is therefore a reinforcing loop that represents the company’s initial implementation efforts (loop R1 in “Training Capacity Story”).
Once the main loop has been defined, other themes can then be incorporated into the central story line. For example, the managers in the TQM story believed that a capacity constraint in training had a negative impact on its TQM efforts. Their individual diagrams showed that as TQM activities increase, the level of TQM skills required increases as people tackle more challenging projects. This increases the demand for training, which reduces the ability to deliver training if training capacity is not increased to meet the rising demand (B2). As TQM training decreases, the TQM skill gap increases, which will hamper TQM activities (B3). The central storyline, or main loop, is thus refined until it captures the essential elements of all the individual maps.
Step 2: Simplify Map Through Decomposition
A typical integrated diagram developed in Step 1 may contain anywhere from 10 to 30 loops. At that level of complexity, most people find it difficult to remember all of the individual loops and their impact on the system as a whole. Therefore, in this step, we simplify the diagram as much as possible by “decomposing” it into smaller, more manageable chunks:
SIMPLIFIED TRAINING CAPACITY STORY
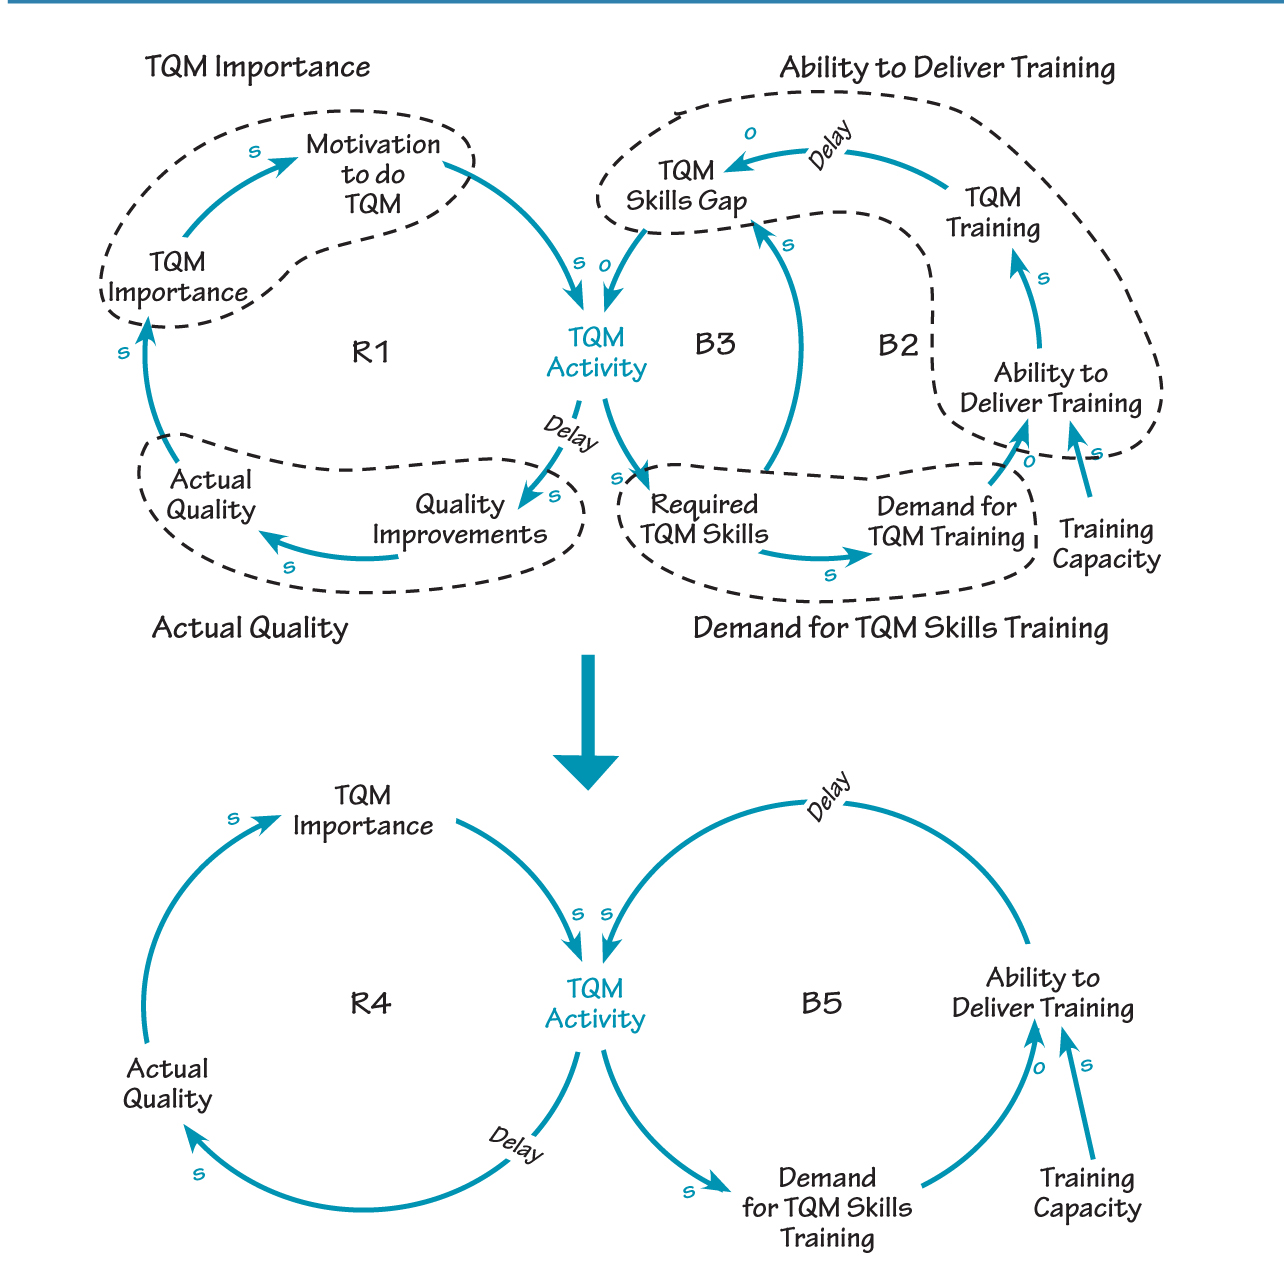
To simplify the diagram, multiple links can be collapsed into a single link. The new link must maintain the meaning of the original relationship and preserve the polarity between the original variables.
- Identify Systems Archetypes. The systems archetypes can be very helpful in decomposition, because they provide a framework for capturing large “chunks” of the whole story. In the TQM example, the presence of a growing action (TQM activity) that is limited by a constraint (training capacity) suggests that a “Limits to Success” archetype may be applicable.
The purpose of using archetypes, however, is not to “force fit” the maps but to see if any of the archetypes can provide us with a lens that will help simplify the story.
- Identify Significant Behavior. If an archetype is not apparent, we can begin the decomposition process by identifying a significant behavior pattern—one that is important to the issue we are studying. Behavior over Time diagrams capture the dynamic relationships between variables on one graph, giving a more explicit understanding of how these variables interrelate.
In the training capacity story, for example, there were two behaviors that stood out: the time behavior of TQM activities and the ability to deliver training (see “Behavior Modes”). Identifying one or more relevant behavior modes helps guide the decomposition process, while enabling us to retain the relevant dynamics.
- Collapse Multiple Links into a Single Link. Although our causal loop diagram only has three feedback loops, it contains 11 variables. To simplify the diagram, we can try to reduce the number of variables. When reducing the number of variables and links in a diagram, we need to be sure that the replacement variable preserves the essential meaning of the individual variables, and the new link preserves the causal polarity between the old set of variables.
For example, we can combine the two variables “Required TQM Skills” and “Demand for TQM Training” into a single variable, “Demand for TQM Skills Training,” because the TQM skill requirement is not as essential to the story as the demand it generates for the training. The net effect to “Ability to Deliver Training” is preserved by signing the arc with an “o.” The entire simplified diagram is shown in “Simplified Training Capacity Story.”
- Check That Loop Polarity Remains the Same. The final step in the decomposition process is to double-check that the loop polarity has not been changed by the simplification process—i.e., balancing loops should still be balancing loops and reinforcing loops should still be reinforcing loops.
BEHAVIOR MODES
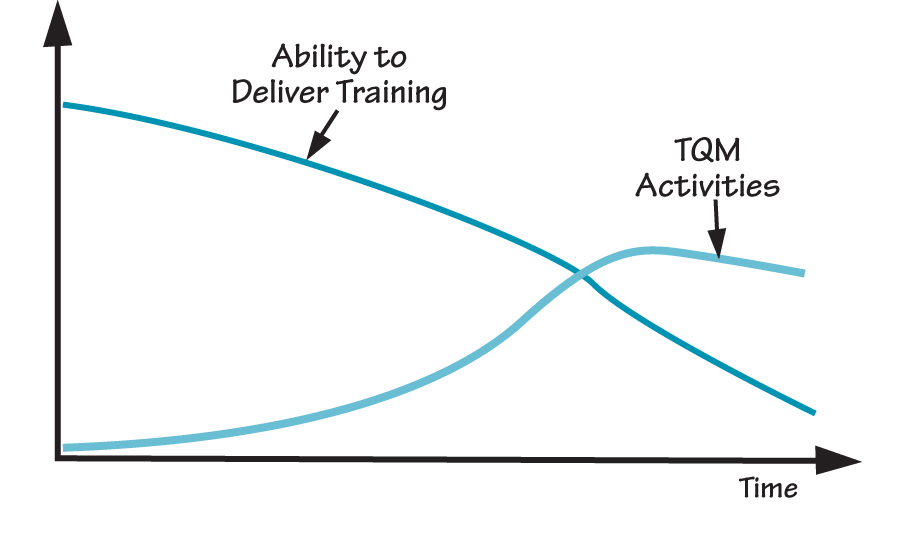
TQM activities grow for a while and then level off as the ability to deliver training decreases. This generic behavior is generally found in “Limits to Success” dynamics.
Step 3: Share Decomposition with Others
To check for consistency between the basic storyline and the simplified causal loop diagram, the diagrams should be continually verified against the available data in the modeling process. The diagrams should also be verified with all people who were originally interviewed to check for “face validity”—whether the diagram reflects the dynamics of what they believe happened.
Step 4: Confirm and Test the Decomposition
In addition to circulating the diagrams to the initial group of interviewees, they should also be shown to other relevant players in the organization. The validation at this stage consists of two parts: one is to determine whether there is general agreement that the final diagram accurately describes what has happened; the second is whether there is a general agreement on the actions suggested by the diagram. There is one important caveat to this analysis, however. Such confirmation does not imply that the final diagrams or the prescribed actions are necessarily “correct.” This methodology only helps capture what people believe to be true based on their current understanding of the situation, i.e., their mental models.
The four-step process of making mental models explicit is not designed to capture “the reality.” Testing the accuracy of mental models is beyond the capability of simple pen and paper tools such as causal loop diagrams or systems archetypes, and requires the use of a computer simulation model.
Daniel H. Kim is co-founder of Pegasus Communications, founding publisher of The Systems Thinker newsletter, and a consultant, facilitator, teacher, and public speaker committed to helping problem-solving organizations transform into learning organizations.