There are many possible starting points for drawing a systems diagram. One way to begin is by telling the story behind the problem, and then seeing if that matches any of the storylines of the systems archetypes (see “Using Systems Archetypes as Different ‘Lenses’,” April 1995). Another approach is to list the important variables or factors that are impacting the problem, and then build a causal loop diagram by drawing the interconnections between those variables.
A third way to begin a systems thinking diagramming process is to look at the problem in terms of trends or behavior over time. Since systems thinking is focused on how systems change over time, it can often be useful to first identify the problem behavior, and then graph the structure that corresponds to that behavior.
Demand Trend
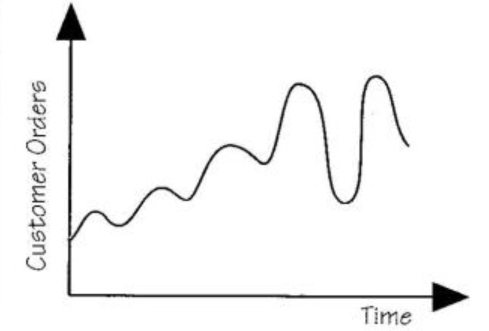
At CMI the number of customer orders over the last two years showed an oscillating pattern with an increased amplitude in the past six months.
Structure-Behavior Pairs
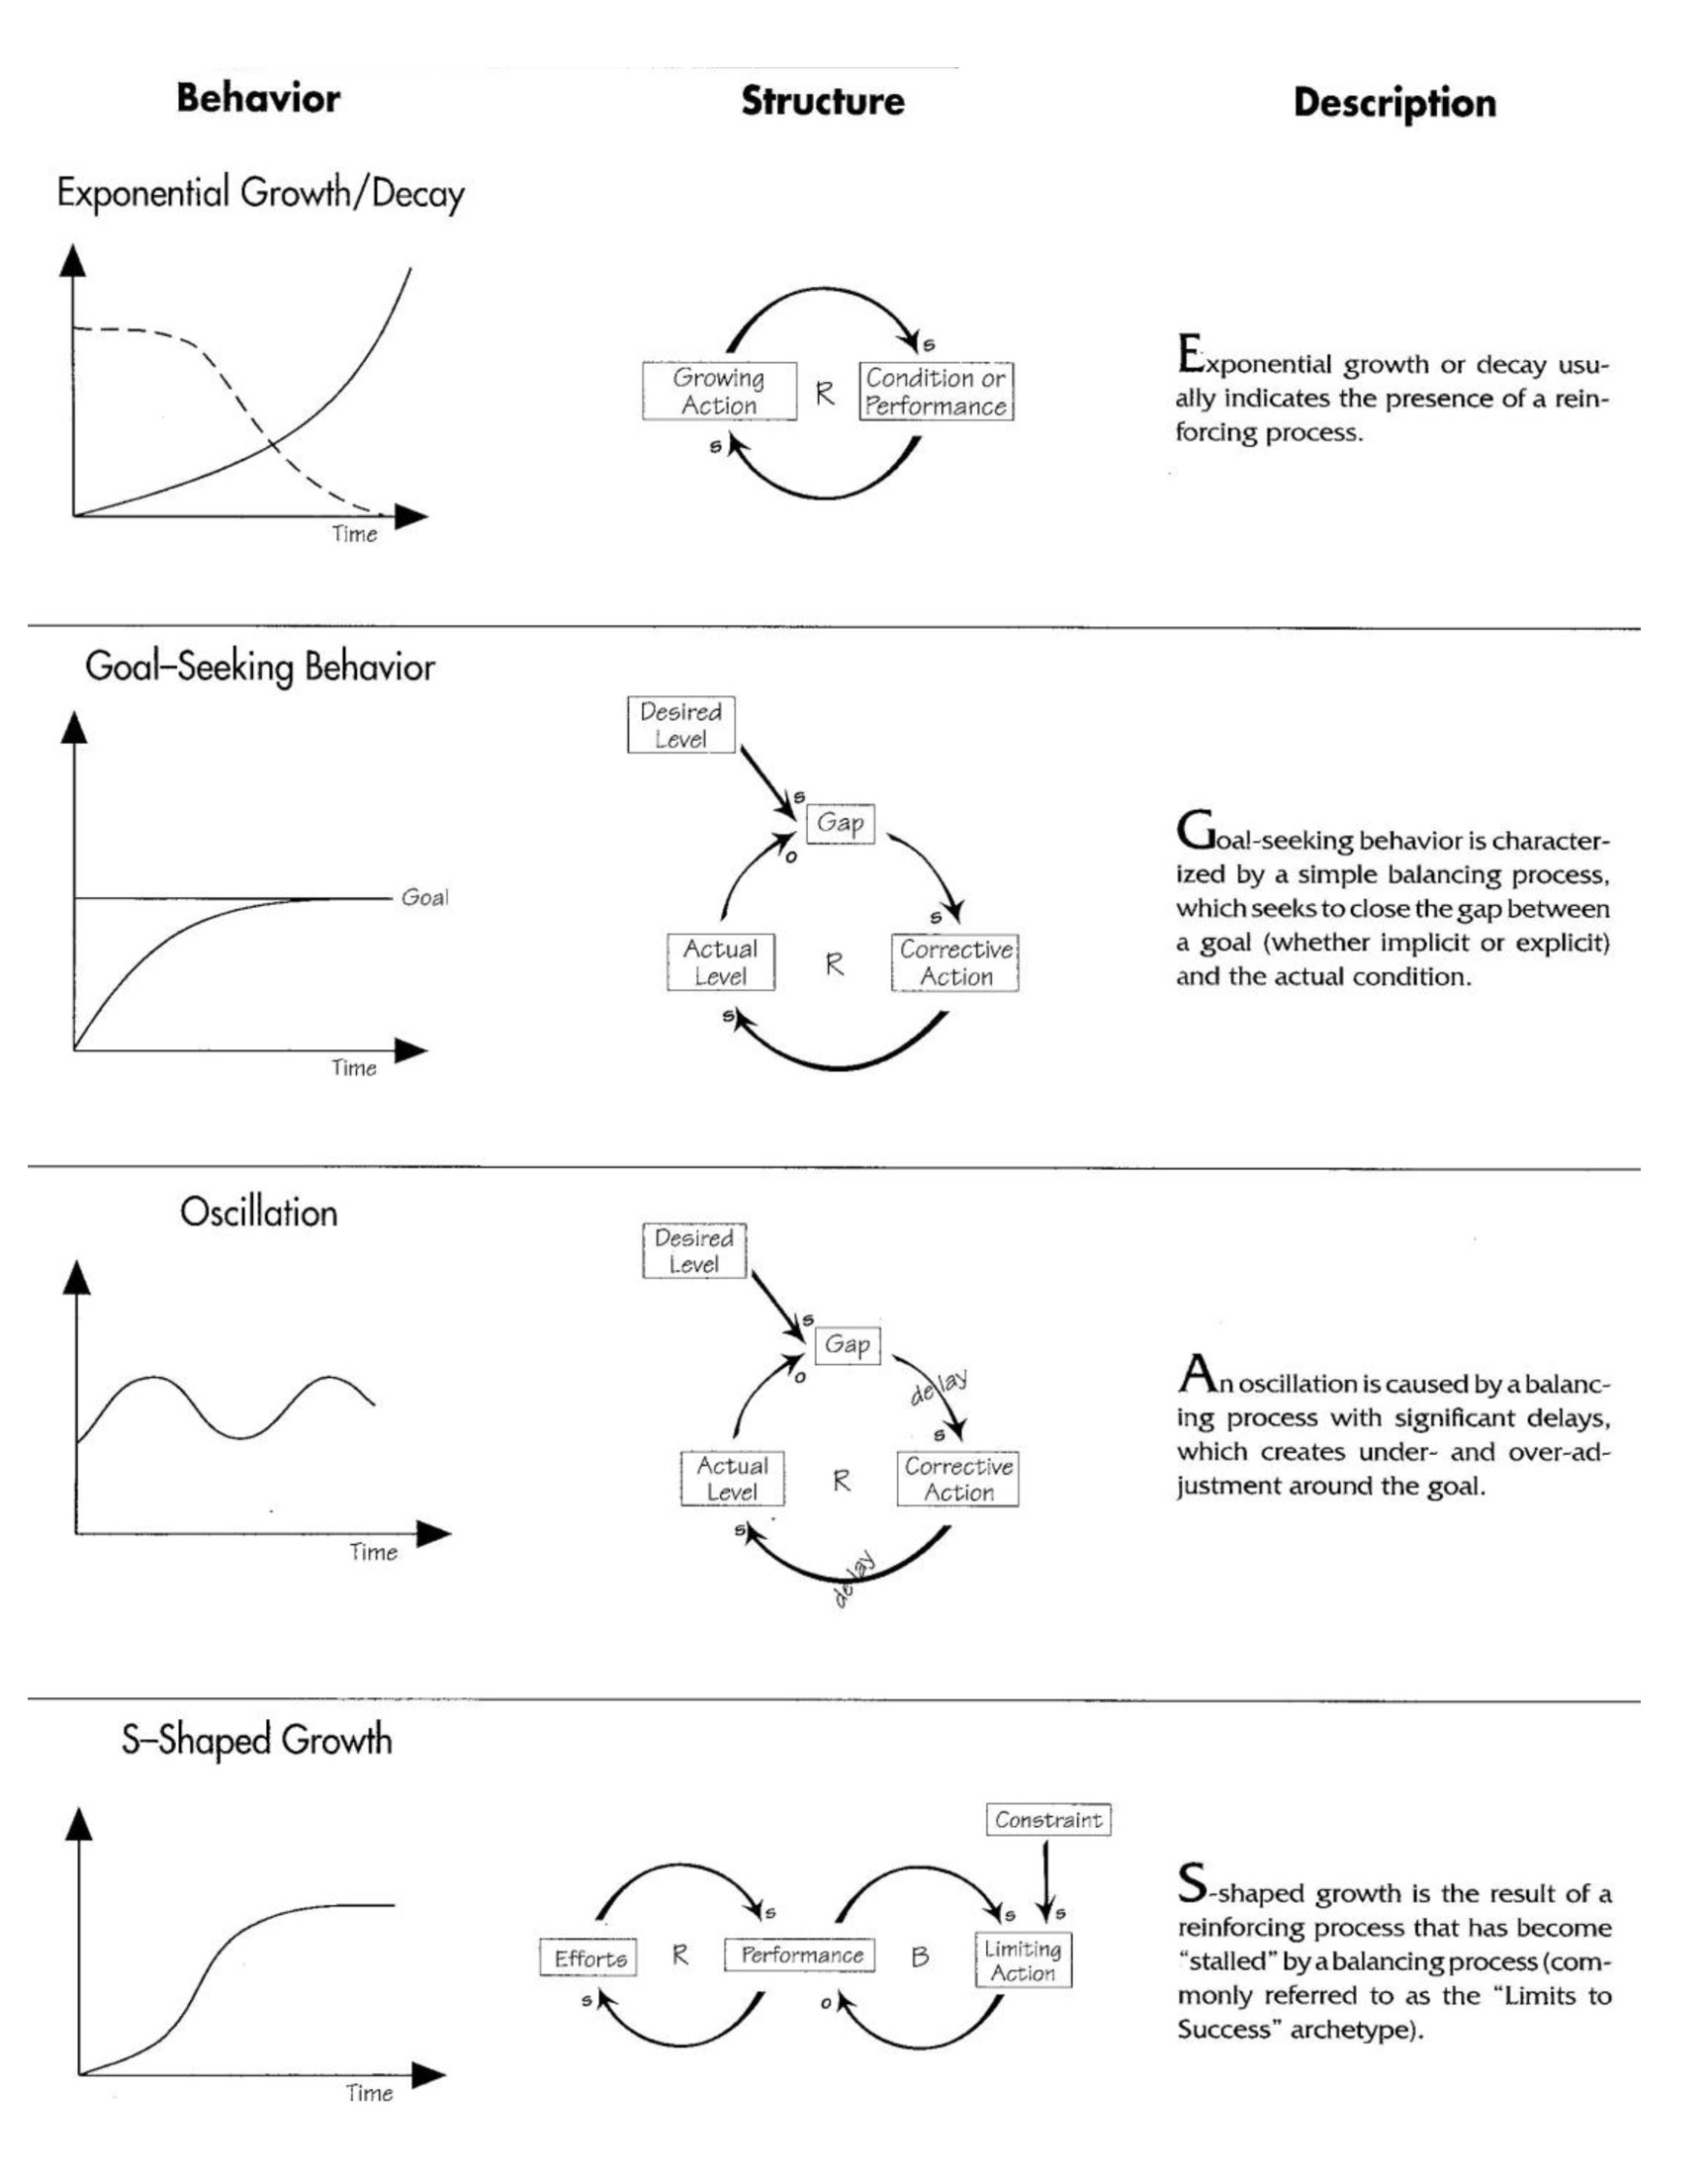
Behavior over time graphs (also called reference modes) allow us to build causal theories by using past history to gain insight into the causal structures underlying a problem. Beginning with observed data or trends allows the system to “speak for itself” and reduces the risk of “force-fitting” the problem into a particular archetype storyline.
Behavior trends also provide clues as to what type of structure might be producing the observed behavior. Over the years, a number of simple “structure-behavior pairs” (common behavior trends and corresponding causal loop structures) have been identified. This library of structure-behavior pairs can provide a useful starting point for building a diagram (see “Structure-Behavior Pairs”). For example, a basic reinforcing structure—which amplifies change in one direction with even more change—produces either exponential growth or decay. Thus, if you are struggling with a problem that involves rapid growth or decline, it is likely that a reinforcing structure is at the heart of the situation.
Creating a Causal Theory
To see how the structure-behavior pairs can be used to create a causal theory of a problem or issue, let’s look at the experience of Custom Manufacturing, Inc. (a fictional name). CMI specializes in taking a commodity material and customizing it to fit the needs of each client, who then turn the material into an end-product and sell it to consumers. Orders are generally placed on a monthly basis, and the company’s turn-around time is roughly two weeks per order. Using this strategy, CMI had successfully created a niche in a growing market, and had experienced steady growth over the last two years.
However, over the last six months the company had seen wild fluctuations in its demand. At first, the managers assumed that this signaled increasing turbulence in the marketplace due to new entrants in the specialty materials niche. They were concerned about remaining competitive in the industry, and hoped that by gaining a deeper understanding of the structural issues involved, they might discover some decisions or policies they could take to affect the order stream, rather than simply reacting to the market trends.
Capturing Historical Trends
To use the structure-behavior pairs, you want to begin by capturing the important historical trends related to the issue. The managers at CMI began by drawing a behavior chart for demand over the last two years (see “Demand Trend”). The graph showed a clear oscillating pattern, which had increased in the last six months. Since the oscillation pattern suggests a balancing process with delays, they spent the next few weeks gathering data and talking to customers to see what might be causing the oscillations in demand.
Structure-Behavior Pairs
Based on this information, and using the balancing loop template as a starting point, they created a causal loop diagram that told the following story: As demand increased, the number of orders to be processed increased. However, processing each customized order at CMI takes specially trained machinists. So when the demand exceeded the capacity of the current staff, the backlog of orders grew, as did the delivery time. But CMI’s customers have their own stream of orders to fill. Therefore, when CMI’s delivery time extended beyond an acceptable period (usually three weeks), their customers would go to CMI’s higher-priced competitors to fill their orders, resulting in a decline in orders at CMI.
Each time the backlog hit a critical level, CMI’s managers responded by adding capacity on a temporary basis. The added capacity, combined with a decrease in incoming orders, enabled the company to work off its backlog, and the delivery time would return to the original two-week goal.
However, it took several weeks for CMI’s regular customers to learn of the improved delivery times and shift their orders back to CMI. Thus, the demand for products oscillated as a function of the company’s internal capacity to meet the growth demand (see “Balancing Capacity and Demand”).
Once they had completed the behavior chart and the structural diagram, CMI’s managers were able to see more clearly how their internal capacity was, indeed, affecting their order stream. Although they had previously assumed that periodic downturns in their orders were the result of competitive pressures or cyclical trends in the marketplace, their systems work suggested that their internal policies could be making the situation worse.
Balancing Capacity and Demand
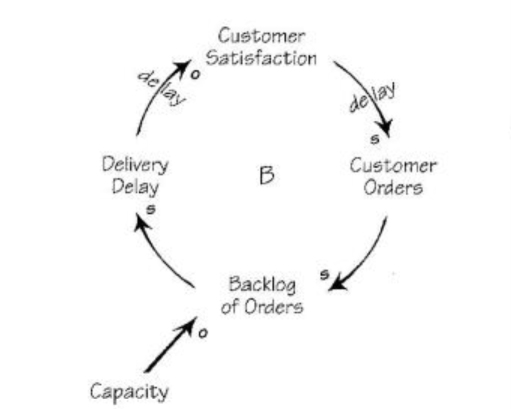
[drop]A[/drop]s the number of orders outstripped the available capacity, the backlog and delivery times increased, leading to a decrease in customer satisfaction. Once those customers took their orders else-where, the reduced number of incoming orders could once again be met using the available capacity, and the backlog fell to an acceptable level leading to a new surge in customer orders.
With their improved understanding of how the company’s internal capacity (in terms of the number of trained machinists) affected its order stream, the managers took steps to institute a flexible workforce policy and to cross-train machinists, in order to be prepared to meet the fluctuations in demand.
Interrelated Patterns of Behavior
In real life, behavior trends are rarely as simple as those listed in the structure-behavior chart. For example, your company may have experienced art overall growth in new customers over the last 18 months, but that growth may have been punctuated by periodic downturns. This is because in most systems there are many reinforcing and balancing processes occurring simultaneously, which produce mixed data. However, the structure-behavior chart provides a good starting point for developing a deeper understanding of a problem. As you dig deeper into the structures at work—and the behaviors they produce—you can enrich your diagram by drawing additional loops until you create an accurate representation of the issue at hand.
Colleen Lannon is co-founder of Pegasus Communications, Inc. and managing editor of The Systems Thinker.