Your management team has been working on creating a causal loop diagram that describes the challenges of launching a new product (sec “Two Product Pricing Models”). Some of the issues, however, still have the team perplexed. For example, the diagram shows that if you increase the price of your product, revenue will also increase. But it also indicates that if you increase the price, sales will fall, causing a drop-off in revenues. Therefore, you need to determine how much can price be raised before the loss of sales counters the increased revenues.
While causal loop diagrams are great for showing the links between elements in a system, the causal loop diagram cannot answer your question. In order to show the relative strength of those linkages, you need to use flow diagrams and create a computer-based simulation model.
One tool that might make your first excursions into model building a little easier is POWERSIM, created by ModellData AS, a Norwegian software company. POWERSIM is a Windows-based visual modeling tool that can help you make the transition from conceptual models to computer simulations.
Accumulator and Flow Diagrams
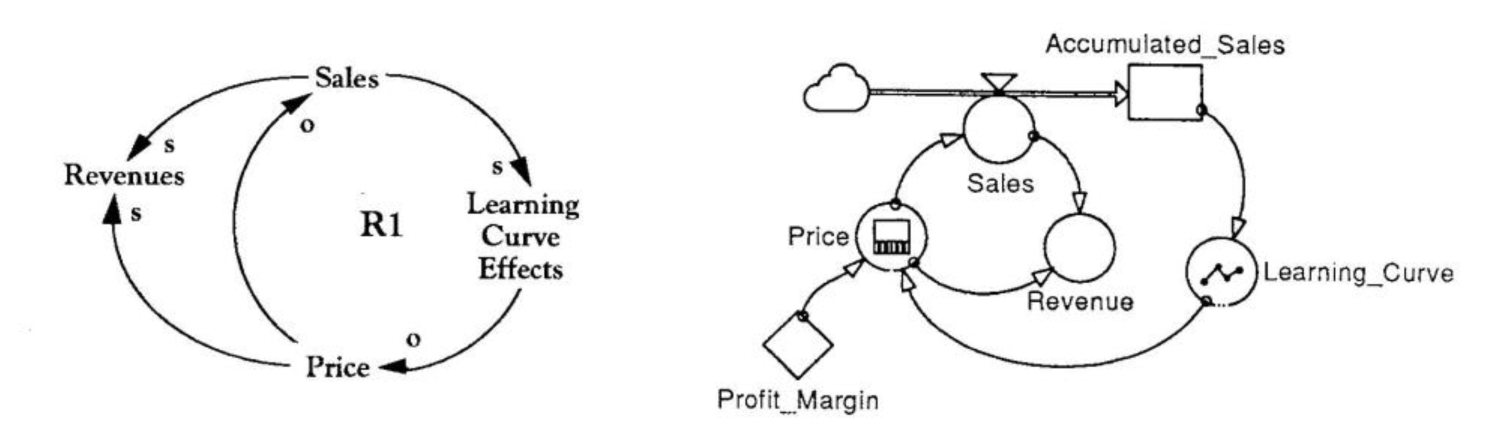
While causal loop diagrams show one type of variable, flow diagrams or accumulator and flow diagrams (AFD) distinguish between three types of variables — accumulators (or stocks), flows (or rates), and auxiliaries. For example, note the differences between the causal loop diagram and the AFD in “Two Product Pricing Models.” In the AFD, each variable is associated with a different icon. The squares in the diagram represent stocks, the circles connected to the clouds are rates, and the free-floating circles and diamonds arc auxiliaries.
Accumulators are distinct from flows in that, if you were able to stop time, you would be able to count or measure things that are stocks. For example, Accumulated Sales in the flow diagram is a tally of total Sales to date. A rate is what controls the entry into and exit out of a level, just as Sales determines how quickly our Accumulated Sales increases. Auxiliaries are variables that help determine the value of the rate. In the pricing example, Revenue, Learning Curve, Profit Margin, and Price are all modeled as auxiliaries. (For a more in-depth discussion of how POWER-SIM represents types of variables, see “Variables in POWERSIM”).
Two Product Pricing Models
Modeling in POWERSIM
Using POWERSIM, you can draw flow diagrams that represent the problem you are modeling on the computer without having to enter the underlying equations until you have refined the model’s structure. This way, you can concentrate on seeing all the relationships among the variables before having to specify how they’re related. This can help ensure that the simulation model your team is creating is consistent with your causal loop-based conceptual model.
It would be impossible to mention all of POWERSIM’s features here, so we’ve listed below some of the ones we feel are most exciting, along with a brief description of each:
Arrays. Arrays allow you to represent many competitors simply by modeling one competitor, adding a subscript to the variables, and changing that subscript to create an identical structure for each competitor. Graphically you still have a small model (which is easier to communicate to others), but operationally you have a powerful, multi-competitor market structure. Using arrays can also make your model more efficient and save time in the modeling process.
Built-in Functions. Suppose you want to calculate the Net Present Value of two alternative pricing strategies. POWERSIM has built-in financial functions to make this process easier, as well as macros and functions that support basic statistics, mathematics, and array capabilities. POWERSIM also gives detailed descriptions of how they implement their functions, which makes it easier to translate your existing models written in other system dynamics modeling languages to POWERSIM. Custom functions can be made on demand.
Management Flight Simulator Development. POWERSIM makes it possible to create management flight simulators (MFS) using its interfacing features. MFSs make it easier to communicate the results of simulations to managers who were not involved in the modeling process. Since these features are integrated with the POWERSIM simulation language, it is easy to connect your model to the MFS, and it eliminates concerns that your MFS will give you different results than your model.
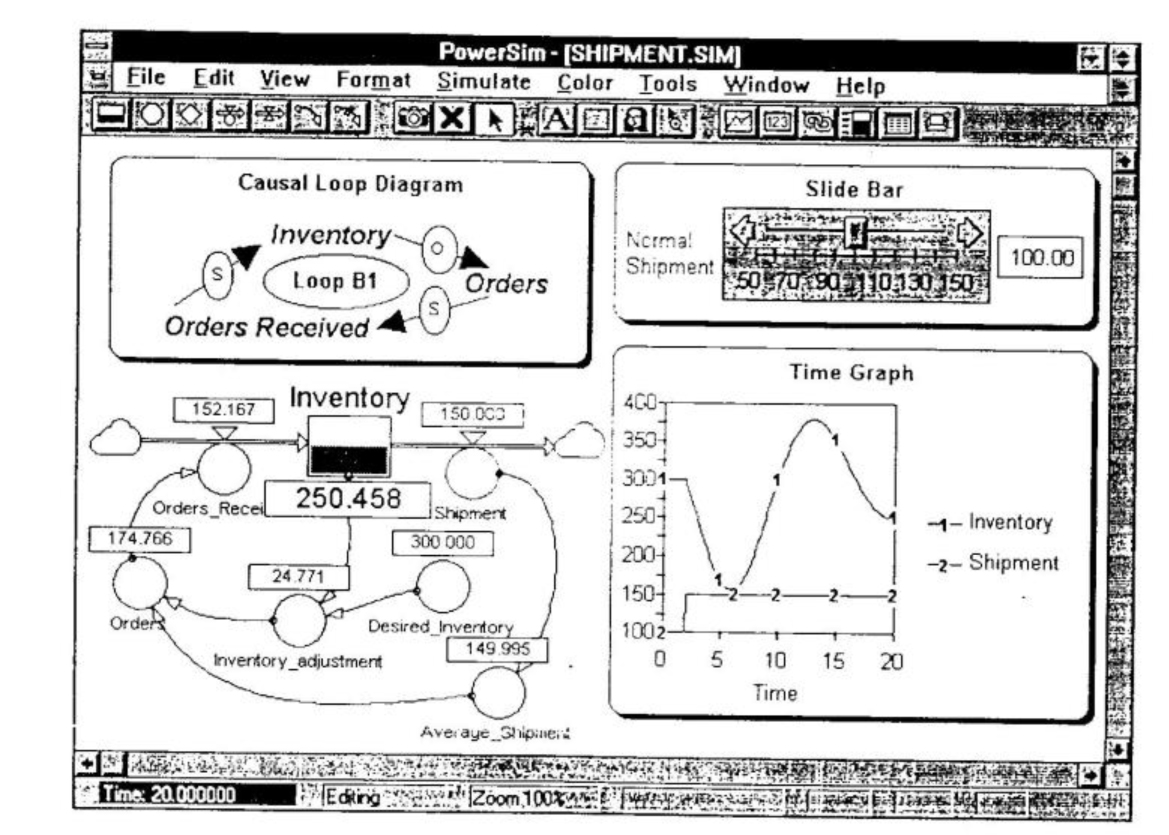
The interface features also make it much easier to enter your input data, and they allow you to control how your output is formatted. For example, you can use slide bars (like the ones on your stereo’s graphic equalizer) to enter your input and then view your output in financial reports such as P&Ls and balance sheets. You can also use POWERSIM to draw causal loop diagrams and include these in your MFS to help document your model.
Opening Multiple Models Simultaneously. Everything related to your model appears in different sections of one window. This allows you to have more than one model open at the same time, making it possible to copy and paste among models easily. This window structure creates another interesting feature — the ability to run models simultaneously. This means you can split your model into a main model and several co-models that can then be connected.
For example, suppose you are developing a model as a team. Once you agree on the names of the parameters in the different model sectors, you can break the model into pieces and work on them separately. The entire model can then be pieced together once the component sectors are completed.
Comparison Runs and Sensitivity Analysis. POWERSIM allows you to save the results of any simulation and then compare the results with other recent runs. You can also create “sensitivity analyses,” that is, you set up multiple simulations with varied inputs (e.g., marketing budget) over a range of specified values. This is very useful when you want to compare model results of different scenarios or debug your model.
Filling the Gap
PowerSIM fills a gap in the toolkits available to managers who want to apply systems thinking to their business problems. Its power and ability to do arrays and handle large models will make it extremely popular with professional model builders, while its graphical interface and low price will make it popular among managers. Both managers and professional model builders who are interested in creating simulations on Windows-compatible computers will love it for bringing a graphical flow diagram-based simulation language to the PC.
W. Brian Kreutzer is vice president of research and development at Gould-Kreutzer Associates, Inc. (Cambridge, MA). He co-authored the second edition of Managing a Nation: The Microcomputer Software Catalog, and is an adjunct faculty member at Lesky College.
Michael Bean is an independent consultant who specializes in Windows-based business simulations.
POWERSIM is a product of ModellData, AS (Norway), phone (47)55-31-32-38.
Variables in POWERSIM
While traditional flow diagrams consist of levels, rates, and auxiliaries, POWERSIM adds o number of other icons. For instance, icons for auxiliaries change depending on whether they are calculated or constant if they are calculated they are drawn as circles, if they ore constant they are represented by diamonds. Rotes are divided into two ports, the rote (traditionally shown as the circle) and the flow (the arrow that attaches a cloud to a level or two levels to each other).
Icons in POWERSIM tell much more than just the variable type. They can also indicate the current value and what functions, if any, are included in the variable’s equation. For instance, if on auxiliary has on equation with o delay function in it, a small square is shown in the auxiliary’s circle to inform the user that this auxiliary has a function that uses an internally-generated level.