Decision-makers often turn to computer models when they face a problem too “big” to grasp all at once. Having the computer keep track of specific values and calculations allows them to focus their attention on accurately representing the issue at hand. The electronic spreadsheet was the first modeling application to gain widespread acceptance in the business community, and it is still the most widely used analytical tool among managers. But spreadsheets, like all tools, have their limitations. So how can managers know when they are applying spreadsheet modeling to appropriate issues, and when it is time to consider other modeling approaches?
Making Decisions in a Complex World
One criteria managers use when deciding whether to create a model of an issue is the degree of complexity involved. But there are at least two distinct types of complexity: detail complexity and dynamic complexity. Detail complexity — which is what we usually mean when we speak of “complexity” — has to do with an abundance of things. Dynamic complexity, on the other hand, deals with an abundance of inter-relationships among things that intertwine and impact one another over time.
Since people tend to associate detail complexity with complexity in general, it is commonly believed that: (1) a system with only a few components is easy to understand, and (2) a system that is difficult to understand must have a tremendous amount of detail associated with it. It is often the case, however, that a system defined by a relatively low number of interrelated things has very complex (and often counter-intuitive) behavior, and is more difficult to understand because of the level of dynamic complexity involved.
Decision-makers run into trouble whenever they use a tool designed to address detail complexity — such as a spreadsheet — to investigate dynamic complexity (see “By the Numbers” on p. 11). Spreadsheets were primarily designed to replicate the simple function of accounting ledgers, not to help managers think about the dynamic complexity that confronts them. This is not to say, however, that spreadsheets do not play a vital function in managerial decision-making.
A spreadsheet’s strength lies in its representation of linear mathematical relationships and in its ability to organize and relate data points — take this month’s number, add it to last month’s cumulative total to get the year-to-date figure, divide that by last year’s year-to-date number for the same month to get the growth rate…and so on. This type of model building may be essential for generating historical performance metrics—especially for financial reporting purposes — but it does not help managers come to any greater understanding of the dynamic complexity that confronts them.
Spreadsheet Models
The Trouble with Spreadsheets
When building a model using a spread-sheet, you enter numbers or formulas into cells. If you enter a number, the display shows…a number. If you enter a formula, the display shows… (typically) a number yet again. Thus, parameter assumptions (numbers) are indistinguishable from relationship assumptions (formulas).
As a result, a model user may find it difficult to tell whether the relationships make any sense, because the formal relationship descriptions lie within the formulas entered into each cell, not the calculation displayed by each cell. But even if you could see all the formulas at once, understanding the relationships they describe would still be over-whelming, since the formulas usually reference other cells. It’s not “Revenue= Price * Quantity,” but “D22 = AF15 * Q8.”
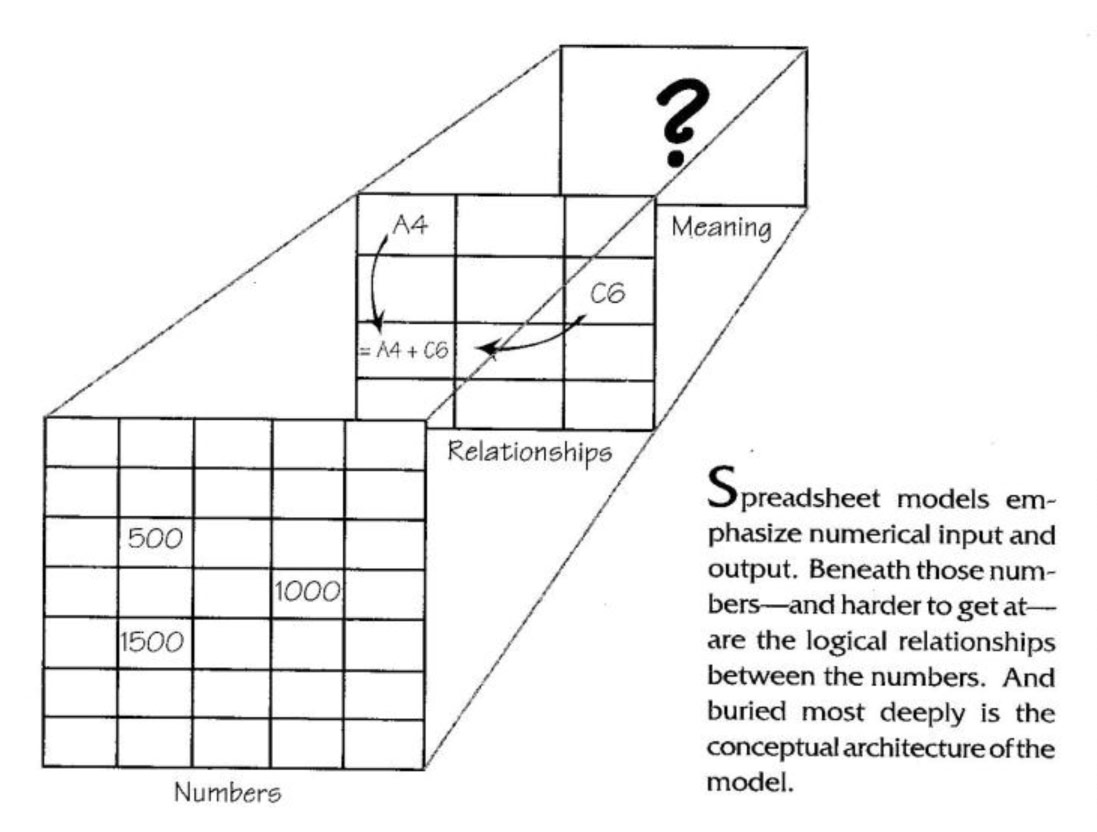
By their very nature, then, spreadsheet models emphasize numerical input and output. Beneath those numbers — and harder to get at — are the logical relationships between the numbers. And buried most deeply is the conceptual architecture of the model. Since you can’t tell which cells are parameter assumptions and which ones are relationship assumptions, the distinction is usually lost in an ambiguity of assumptions (see “Spreadsheet Models” on p. 9).
System Dynamics Models
System Dynamics Models
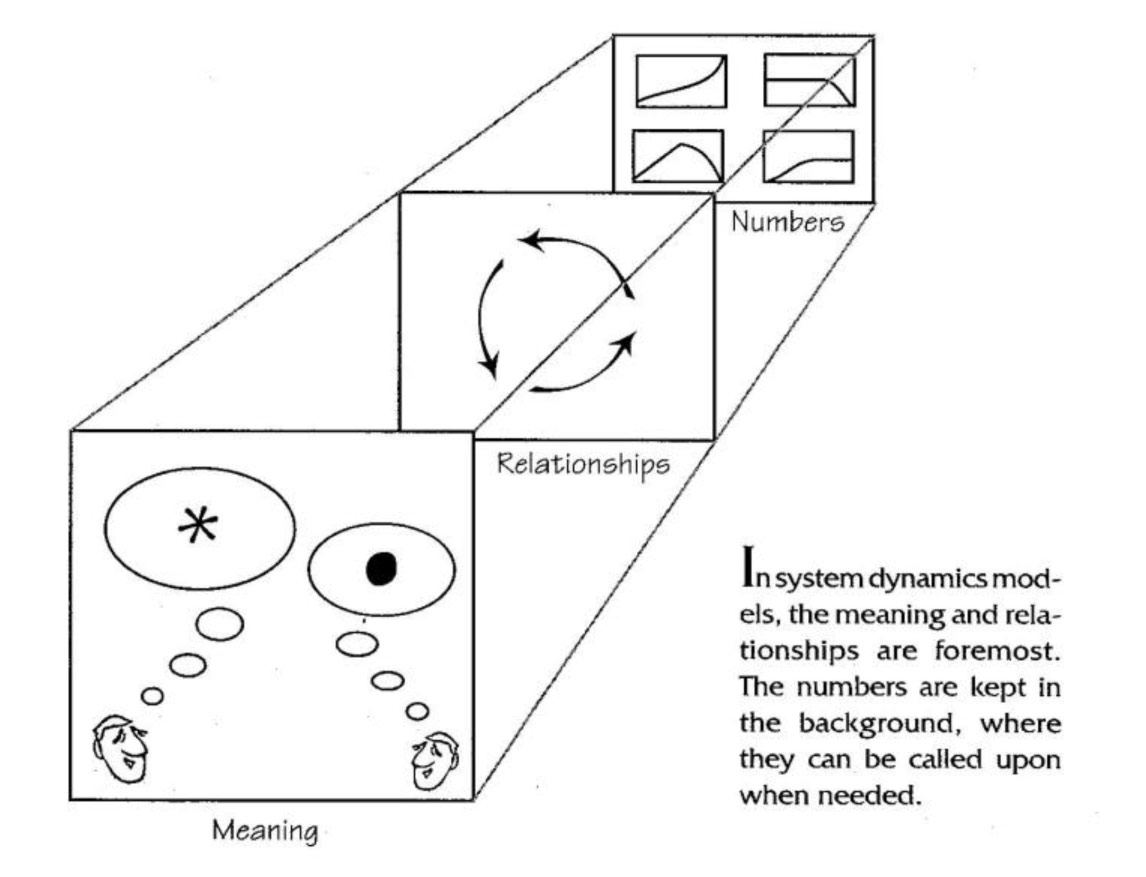
In a system dynamics modeling effort, the inter-relationships are foremost. Unlike spreadsheets, which present the numbers and hide the relationships, system dynamics models present the relationships and keep the numbers in the background. The numbers and calculations can be accessed whenever needed, of course, but they do not get in the way of thinking about the problem (see “System Dynamics Models”).
Whereas the assumptions underlying a spreadsheet model are often difficult to pin down, system dynamics models are designed to capture visually the assumptions about how elements in a system interrelate. The relationships among the variables are represented in the model-building process using a graphical interface, which presents the model user with different graphical icons of the assumed parameters and relationships, thus making the assumptions explicit. When reviewing the model with someone else, the graphic representation of the assumptions easily and naturally focuses the discussion on the structure of the problem, not just the numerical output.
It is this natural emphasis on making assumptions explicit and then testing them, improving them, and sharing them with others that improves and builds confidence in the model. The old saying “two heads are better than one” takes on real meaning when multiple managers can effectively contribute to a model’s construction. It also provides a link to the broader context of organizational learning. Getting traditional, quantitatively oriented managers to talk about their assumptions and inquire into other viewpoints is a good first step in getting them to think more broadly about the assumptions they make every day, how those assumptions impact their behavior, and how both behavior and assumptions can create barriers to organizational learning.
Enhanced Decision-Making for a Dynamic World
System dynamics modeling distinguishes itself from spreadsheet modeling primarily because of its impact on a manager’s thinking. Technically, spreadsheet software can be used to build a stock-and-flow model, just as system dynamics software can be used to create spreadsheets. But depending on the problem, one type of modeling approach will provide better direction than the other.
Static issues such as “How are we performing today?” or comparisons of static issues such as “How is our performance compared to last year’s?” suit themselves to spreadsheet analysis. Dynamic issues such as “How is our performance changing over timer’ suit themselves to system dynamics modeling, because the modeling process encourages the person to think about the system structure and ask questions that will make those structures explicit.
Although the structural language of stocks and flows takes time to learn, once one becomes conversant in it the ease of communications and transfer of systems models increases dramatically — just as it did when people were first familiarizing themselves with spreadsheets.
Know the Purpose
The bottom line in choosing a modeling approach is to be clear about the purpose of a model before you build it—especially whether the situation to be modeled contains detail complexity or dynamic complexity. Using a spreadsheet to address a problem containing dynamic complexity can lead to ineffective or erroneous decision-making, because although spreadsheet models are very effective for capturing metrics, they have limited capability to help managers understand the dynamic implications of decisions over time.
It is always important to know where the company stands relative to its performance indicators, and metrics are great for providing such static pictures of an organization. But to succeed in turbulent and changing times, managers must also invest in forward-looking models that provide a greater understanding of their organization and its environment.
Gregory Hennessy Is an associate at GKA Incorporated. He holds a master’s in management from the MIT Sloan School of Management and a master’s in social sciences from the California Institute of Technology. He has worked primarily in the telecommunications, healthcare and energy industries, and has built spreadsheet, econometric, and system dynamics models.
Editorial support for this article was provided by Colleen Lannon.
By the Numbers
The rise of spreadsheets has created several numerical illusions for decision-makers:
Illusion of Accuracy. The first is the illusion of accuracy in quantitative models, arising from a confusion between accuracy and precision. In the world of computer models, “accuracy” is the extent to which a model represents reality, whereas “precision” refers to the number of significant digits in the model’s output. It is possible to have an accurate model without much precision (“My model indicates that it takes about 8 minutes for light from the sun to reach the earth”), just as it is possible to have a precise model without much accuracy (“My model indicates that it takes 2389953 months for light from the sun to reach the earth”). Because spreadsheets blindly calculate numbers to several decimal places without regard to the significance of such precision, decision-makers have grown accustomed to model output with unreasonable precision. The psychological impact is that this impressive display of precision lulls decision-makers into overconfidence in the accuracy of the models they are using.
illusion of Reduced Complexity. The second illusion is that of reduced complexity. As spreadsheets proliferated, so did the emphasis on the practice of management “by the numbers.” The abundance of quantitative analysis led to a focus on any of a handful of metrics to reach a decision: IRR, ROE, NPV, RONA, ROI. These and other common metrics usually leave out qualitative considerations, since qualitative issues are too difficult to measure or too imprecise to include. So what is put into the model are only those nice, tidy considerations that are easily quantifiable and measurable. If a concern is hard to quantify and measure, and if it’s not being used in the decision-making process, managers are unlikely to spend much time thinking about it. It’s not surprising, therefore, to find that many managers have grown accustomed to thinking about their challenges in a “simplified” world.
illusion of Reduced Risk. Together, these two illusions create a third—the illusion of reduced risk. A management team that has dramatically simplified its representation of the organization and business environment, and is over-confident about the accuracy of its computer models, is likely to be overconfident about its ability to manage the uncertainties it faces. One manifestation of this is that the team might ask the planning department to do the impossible—to predict the future with point-to-point accuracy and precision, taking into account all of the uncertainties (appropriately weighted, of course) that face the organization. To counter this dangerous trend, scenario planning has emerged as one process for forcing managers to consider a broad range of risks.