There is a full array of systems thinking tools that you can think of in the same way as a painter views colors many shades can be created out of three primary colors, but having a full range of ready made colors makes painting much easier. The systems thinking tools fall under several broad categories: brainstorming tools, dynamic thinking tools, structural thinking tools, and computer based tools. Although each tool is designed to stand alone, they also build on one another and can be used in combination to achieve deeper insights into dynamic behavior.
Brainstorming Tools
DOUBLE-Q DIAGRAM
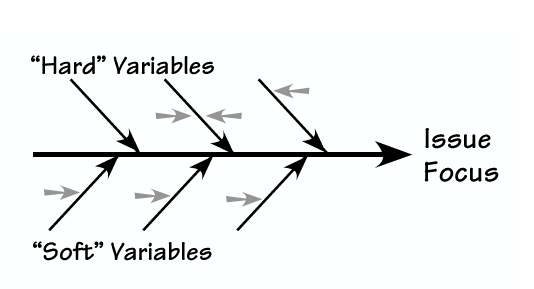 Based on “fishbone” or cause and effect diagram. Captures free flowing thoughts in a structured manner, and distinguishes between “hard” (quantitative) and “soft” (qualitative) variables that affect the issue of interest. Is structured during a brainstorming session; helps participants see the whole system in question.
Dynamic Thinking Tools
BEHAVIOR OVER TIMEGRAPH
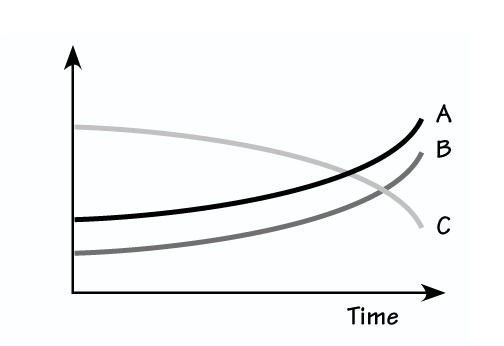 Can be used to graph the behavior of each variable over time and gain insights into any interrelationships between them. (BOT diagrams are also known as reference mode diagrams.) Can include past, current, and future behavior.
CAUSAL LOOP DIAGRAM
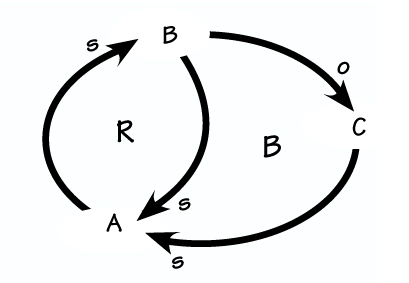 Captures how variables in a system are interrelated, using cause and effect linkages. Can help you identify reinforcing (R) processes, which magnify change, and balancing (B) processes, which seek equilibrium.
SYSTEMS ARCHETYPE
 Helps you recognize and manage common system behavior patterns such as “Drifting Goals,” “Shifting the Burden,” “Limits to Success,” “Fixes That Fail,” and so on all the compelling, recurring “stories” of organizational dynamics.
Structural Thinking Tools
GRAPHICAL FUNCTION DIAGRAM
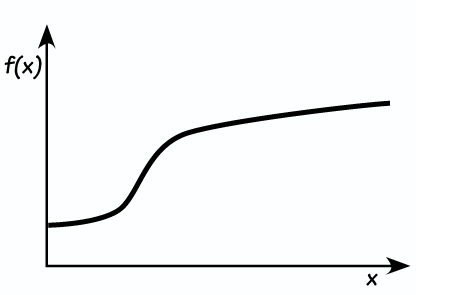 Captures the way in which one variable affects another, by plotting the relationship between the two over the full range of relevant values. Useful for clarifying nonlinear relationships between variables.
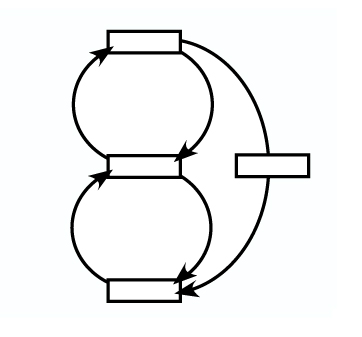
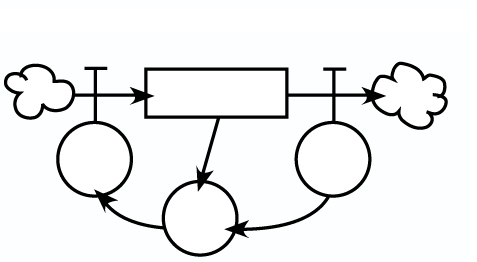
STRUCTURE-BEHAVIOR PAIR
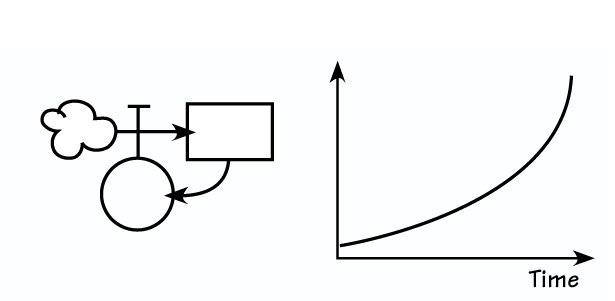 Consists of the basic dynamic structures that can serve as building blocks for developing computer models (for example, exponential growth, delays, smooths, S-shaped growth, oscillations, and so on).
POLICY STRUCTURE DIAGRAM
 A conceptual map of the decision making process embedded in the organization. Focuses on the factors that are weighed for each decision, and can be used to build a library of generic structures.
Computer-Based Tools
COMPUTER MODEL
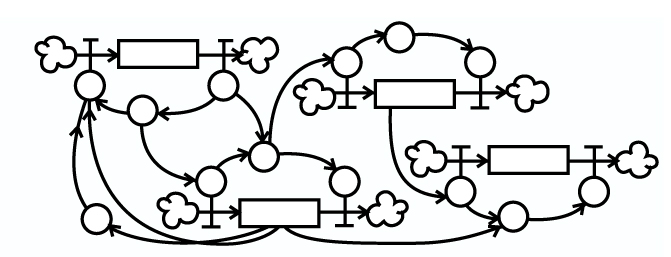 Lets you translate all relationships identified as relevant into mathematical equations. You can then run policy analyses through multiple simulations.
MANAGEMENT FLIGHT SIMULATOR
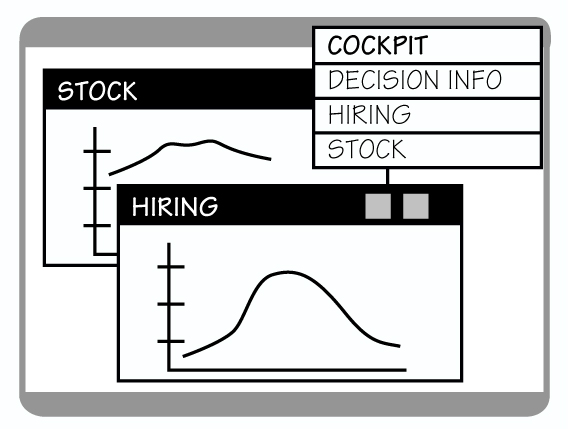 Provides “flight training” for managers through the use of interactive computer games based on a computer model. Users can recognize long term consequences of decisions by formulating strategies and making decisions based on those strategies.
LEARNING LABORATORYA
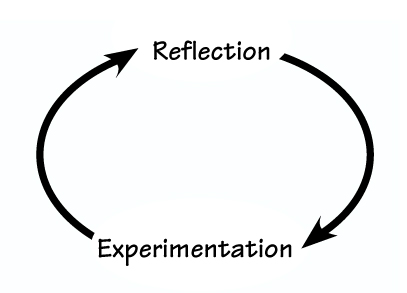 A manager’s practice field. Is equivalent to a sports team’s experience, which blends active experimentation with reflection and discussion. Uses all the systems thinking tools, from double-Q diagrams to MFSs.