Connections among the main actors in any system are complex; they include factors such as whether the parties are suppliers or customers in the relationship, whether they share resources, and whether they are allied or in conflict with each other. The relationship-assessment stage of SVOM involves describing the relationships between the different stakeholders in the organization from each stakeholder’s point of view (see “The Relationship Assessment Process”). This analysis highlights convergences and divergences in perspectives as well as the potential for alliances and conflicts among different actors sharing common resources.
Most relationships between stakeholders or departments are reciprocal. For example, in some cases, I am the supplier and you are the client. In other circumstances, you may be the supplier and I may be the client. Groups generally have their own unique perspectives on these same relationships. An initial assessment of these connections provides insight from the following three perspectives:
- What each group thinks it is trying to achieve (its objectives and main problems)
- How each group sees its role vis-àvis the other groups in the system (supplier and customer relationships)
- How the groups differ in their perceptions of the same supplier and customer relationships (comparing their interpretations).
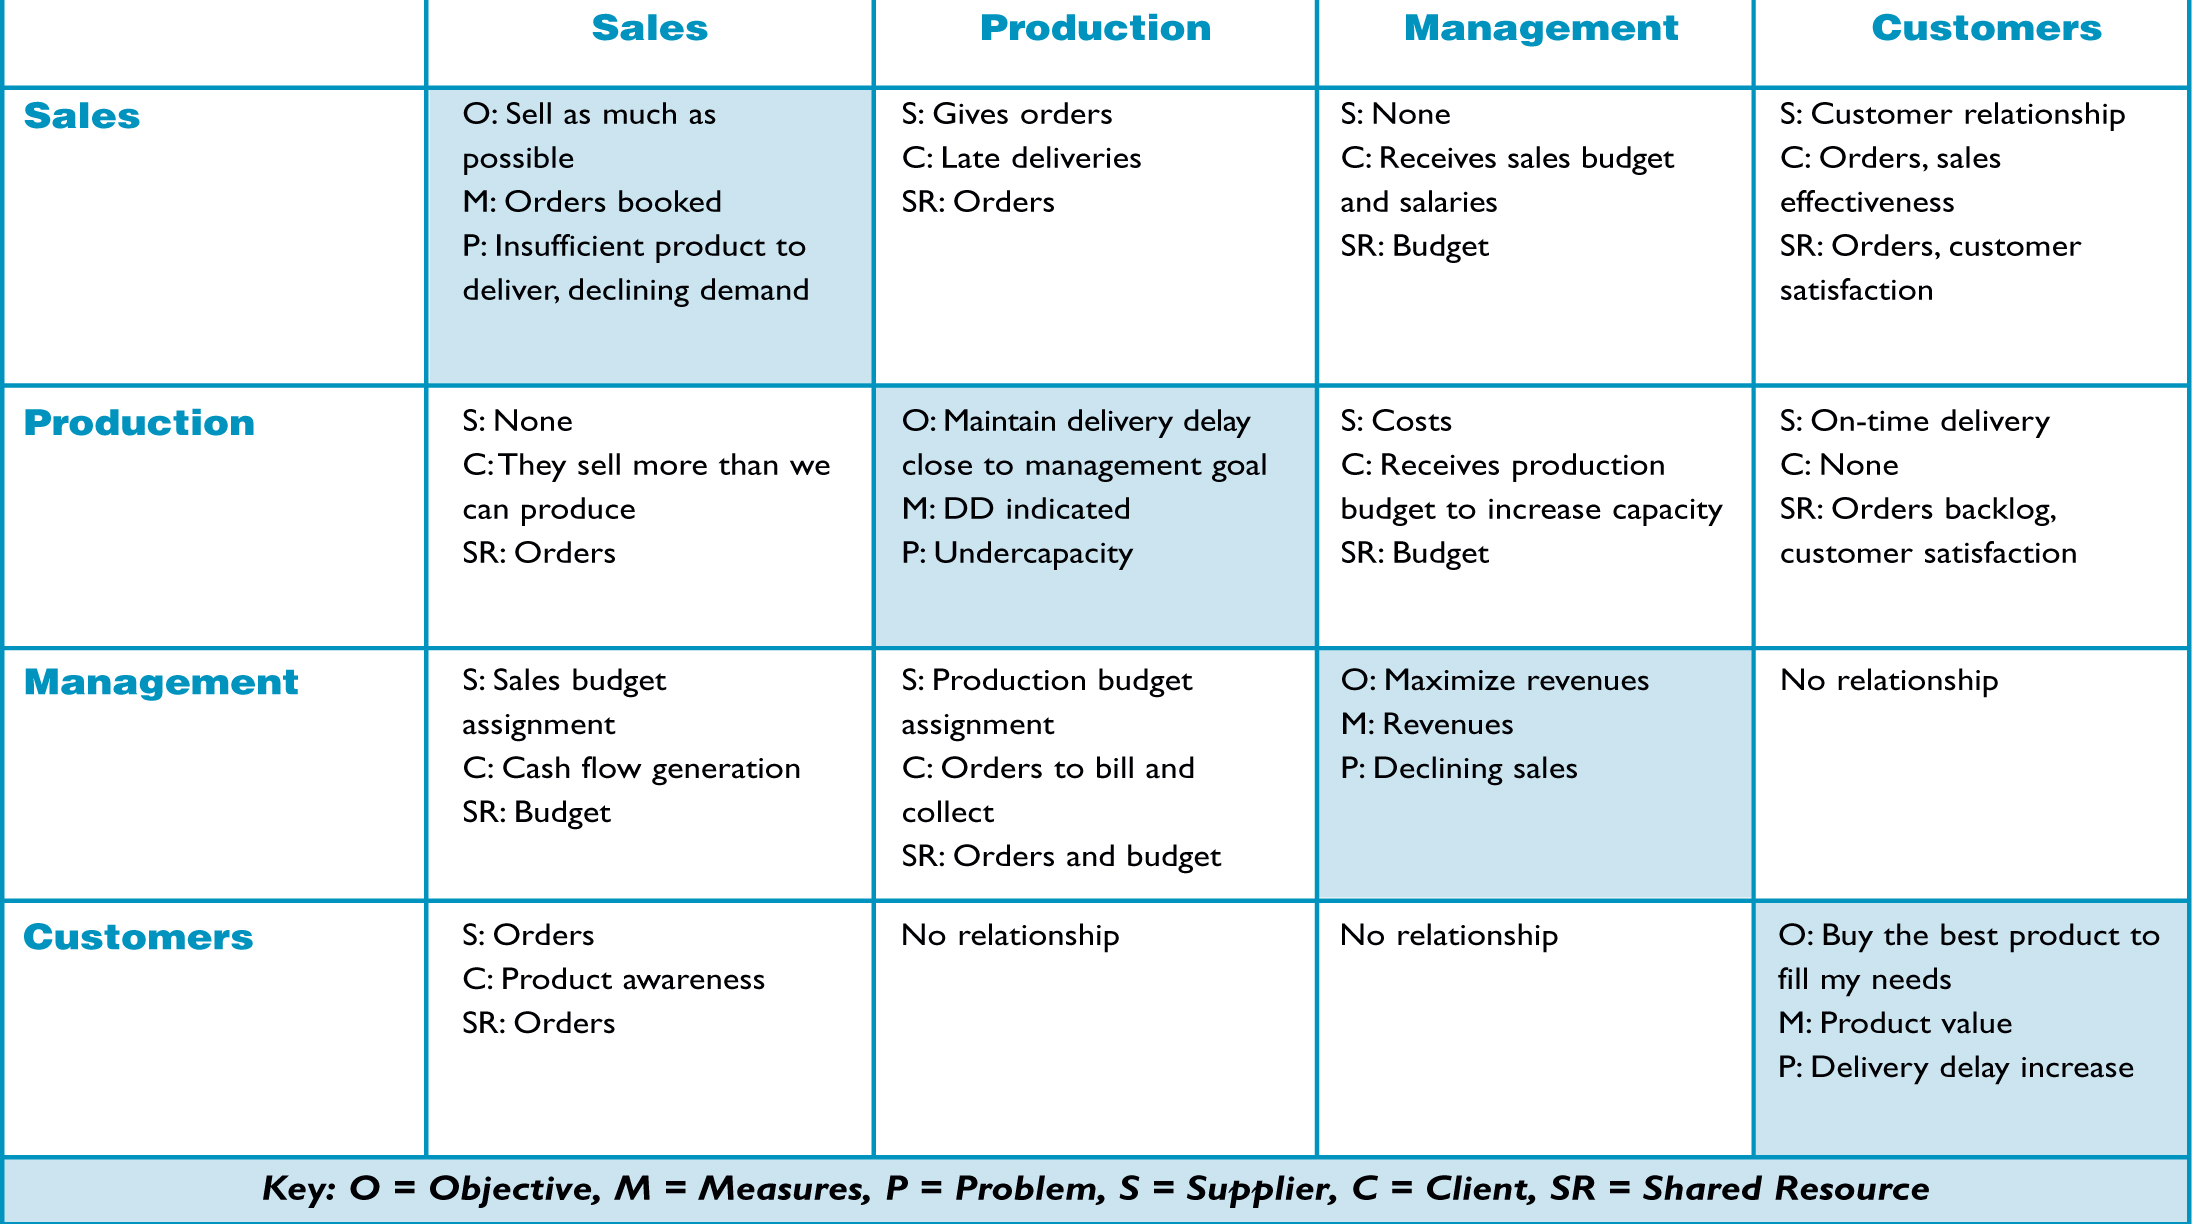
In organizations, problems often stem from misaligned perceptions about the same relationships, leading to conflicts in the use of shared resources. Making such assumptions explicit lets us come to a common understanding about how our actions affect the overall system. Let’s revisit the Market Growth Model and assess the relationships involved (see “Relationship Assessment for the Market Growth Model”).
We’ll start with the first perspective, “What each group is trying to achieve” (labeled “O” for objectives and “P” for problems in the chart). We can see that each department has a goal that makes sense from its particular point of view. Moreover, the main challenges that each function faces derive from the actions that other departments take. For example, the Production department wants to maintain delivery delays close to management’s goal; however, they continually lack the capacity with which to meet demand. This undercapacity is a result of the Sales group’s efforts to fulfill their mandate by booking as many orders as possible. Yet Production’s inability to keep up with demand causes Sales to struggle to deliver orders on time; this backlog erodes product attractiveness and ultimately reduces sales.
From the second perspective, “How each group sees its role vis-àvis other groups” (labeled “S” for supplier and “C” for customer relationships), we see that departments often have different expectations of the same relationships. For example, the Sales group’s perception is that, as a supplier, they provide Production with orders and that, as a client, they receive deliveries from Production
THE RELATIONSHIP ASSESSMENT PROCESS
- Create a square matrix including all of the organizational groups that were reflected in the SVOM overlay.
- Identify each group’s key objectives, the main measure that indicates how well they are achieving their goals, and the principal problems they face. Write these in the square where the group’s name is listed in both the column and row (e.g., Sales x Sales).
- Identify how each group perceives its relationship with the others, from both the supplier and customer perspectives. From the supplier perspective, ask, “What is important for me to provide to that group?” From the customer perspective, ask, “What is important for me to receive from that group in order for me to do my job?”
- Based on the supplier and customer perspectives, identify the resources that both groups share.
- Identify misalignments in the perceptions of the different groups.
later than they agreed with the customers. When Production is behind schedule, their lateness affects Sales’ ability to sell more products. The Production group, for their part, may not believe that they have a supplier relationship with Sales, but rather with the end user. The team may also think that, as a customer, they receive more orders from Sales than they can deliver on time.
From the third perspective in which we compare the two interpretations, any misalignment in perception reflects poor communication. In our example, this weakness exists even though the relationship between the Sales and Production departments directly affects at least two key resources—, “Capital Invested in Capacity” and “Customer Base.” The lack of communication leads to ineffective allocation of financial resources, insufficient production as a consequence of the lack of capacity, and a decrease in the client base over time. Thus, in addition to increasing the groups’ difficulty in achieving their local goals, this misalignment in incentives also leads to difficulty in achieving the organization’s overall goals.
Rational Perspectives, Potential Conflicts
In the first article, the “Growth and Underinvestment” analysis revealed that as sales increase faster than the Production group can adjust its capacity, delivery delays rise. The relationship assessment deepens our understanding of this situation by showing that this problem is created by two seemingly rational, local strategies: (1) maximize capacity utilization (Production), and (2) sell as much as possible (Sales). In addition to illuminating the conflicts that these misalignments bring to the system, the analysis helps to identify where the incentives should be changed. For example, having the Sales group share responsibility for order backlog with Production will change their perspective from “sell as much as you can” to “sell as much as you can produce with current and future capacity.” This shift in accountability aligns local objectives and improves company performance.
The SVOM process brings to the surface the effects that an organizational design can have on the management of shared resources and on a company’s ability to achieve both local and global goals. Such goals may differ from department to department, because each function has a unique culture, perspective, and area of expertise. By provoking deep discussion about the assumptions that have created such operational divides throughout the organization, groups learn to view the system differently. This change in perspective moves the discussion from blaming each other (and the resulting win-lose power struggles) to working together to realign perspectives, performance expectations, and incentives.
James L. Ritchie-Dunham is president of SDSG, LLC (The Strategic Decision Simulation Group), executive director of The Leverage Institute, and a consultant member of the Society for Organizational Learning. Annabel Membrillo is a consultant with SDSG, LLC.
RELATIONSHIP ASSESSMENT FOR THE MARKET GROWTH MODEL