Most of us are familiar with the story of Sir Isaac Newton sitting underneath an apple tree and “discovering” the law of gravity when he saw an apple fall (some say on his head). Had Newton been an entrepreneur, he might have discovered another law. With apple sales — and profits — in mind, he might have shaken the tree vigorously, causing more apples to drop to the ground. The harder he shook, the more apples would fall, meaning more sales and more profits. After a while, however, each shaking would produce fewer and fewer apples.
We can almost picture the scene: Sir Isaac wipes the sweat from his brow, then climbs the tree to knock down the tenacious few apples left. Precariously perched, he strains to reach one of the last remaining apples. The limb gives away, and he falls. As he lands on the ground, another discovery hits him — the Law of Diminishing Returns.
The Law of Diminishing Returns
The phenomena of diminishing returns — when more effort yields fewer results — is ubiquitous. Oil recovery and mining operations exhibit this behavior. Companies experience rapid new product sales followed by decreasing demand. At a personal level, we see that working longer hours, jogging more miles, and eating less food lead to diminishing returns in productivity gains, health benefits, and weight loss.
The Law of Diminishing Returns can be considered the law of gravity for the business world. Launching a marketing campaign, for example, is like shooting a cannonball — the returns climb higher and higher, until the “force” of diminishing returns kicks in and pulls the rate of return down.
When traced out over time, the cumulative returns of the marketing effort produce an S-shaped curve.
The law of diminishing returns is essentially about saturation effects — reaching the limits of a particular system. The characteristic S-shaped behavior can be produced by two different structures: the well-known Bass diffusion model and the more general “Limits to Success” archetype. At the heart of both structures is a pair of reinforcing and balancing loops which interact to produce the S-shaped pattern.
Diffusion Dynamics The basic Bass diffusion model is usually given as a set of equations:
f(t) = dF(t)Idt = (p+qF(t)) 1 1 – F(t)] p, q 0 p = coefficient of advertising, q = coefficient of interaction. Integration yields an S-shaped growth curve of diffusion. Although the equations may offer an elegant way to represent such dynamics, most of us don’t view the world as a set of equations. From an accumulator and flows perspective, we see diffusion dynamics as a flow of people from a pool of potential adopters to adopters (see “Bass Diffusion Model” diagram). Instead of p’s and q’s, we talk about an advertising effect and a word-of-mouth effect. This structural view makes the dynamics more explicit, closer to the way we actually think about and experience the world.
Bass Diffusion Model—A Structural Viewpoint
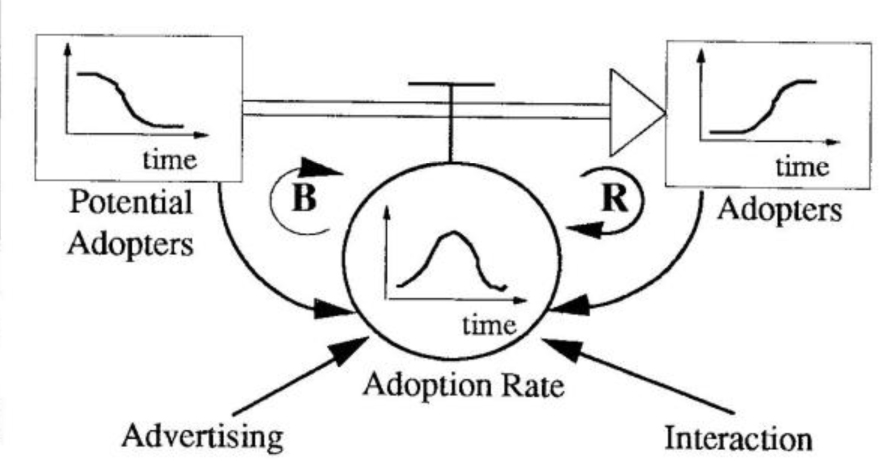
Faddish products, such as hula hoops and Cabbage Patch dolls, usually exhibit classic S-shaped growth. Remember the sudden popularity of “Pet Rocks” in the late 1970s? They were just plain old rocks repackaged in a pet-carrier style box. At lust, driven by strong advertising, they were viewed as a popular novelty item. Sales began to grow, increasing the demand for the rocks and the word-of-mouth endorsements. Soon sales — and the rocks’ popularity — began to skyrocket. But eventually the pool of potential adopters (or potential Pet Rock owners, in this case) was drained and there was no one left to buy them.
Capacity Limits
In general, diminishing returns occur whenever we hit a capacity limit. In the Bass model, capacity is the number of people who can ultimately become adopters of a particular product, technology, or idea. The adoption rate falls to zero when the potential adopter’s accumulator is depleted, or, in the Pet Rock case, when everyone comes to their senses (whichever comes first!).
The “Limits to Success” archetype (Toolbox, December 1990/January 1991) is another way of describing the capacity limit dynamics that produce S-shaped behavior. In a “Limits to Success” structure, a system’s performance improves due to certain efforts. Better performance results in more efforts, leading to further improvement (loop RI in the “Limits to Success — From Archetype to Accumulators” diagram). Over time, however, performance begins to plateau despite increased efforts — the system has reached some limit or resistance which is preventing further improvements (loop B1).
If we look at the “Limits to Growth” archetype from an accumulator and flow perspective, we can see more clearly the structures producing the unwanted behavior. In a service organization, for example, service capacity may become the limiting factor if it does not keep up with increasing demand. In the beginning, growth in customers will lead to higher revenues, increased marketing, and further growth in customers (loop R2). This reinforcing loop drives the initial growth of the customer’s accumulator.
Limits to Success—From Archetype to Accumulators
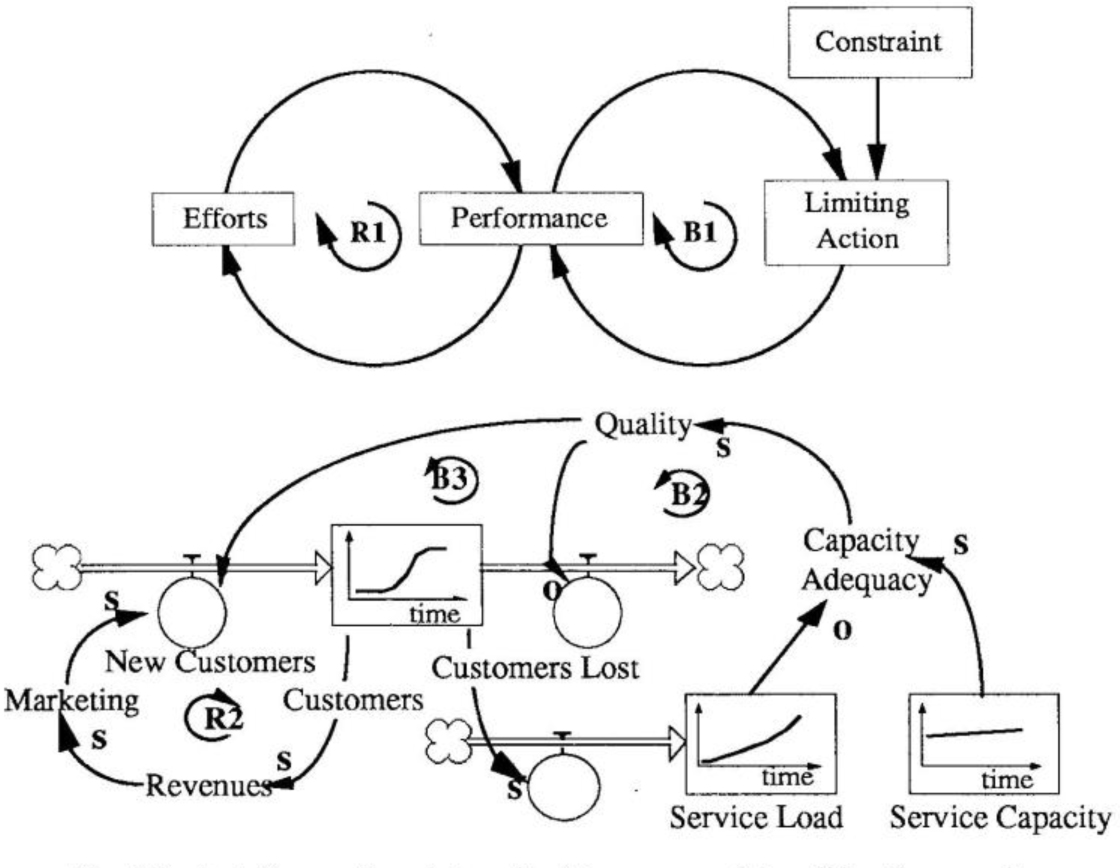
As the number of customers grows, however, so does the service load on the company. If the service capacity does not grow at least as fast as the service load, capacity adequacy decreases. This leads to lower quality and produces a downward pressure on customer growth. That is, capacity constraints eventually diminish the effectiveness of the marketing efforts.
In both the Bass diffusion model and the “Limits to Growth” archetype, the S-shaped curve is produced by a reinforcing loop coupled with a balancing loop. The reinforcing loop creates the initial growth in demand, while the balancing loop is generally responsible for the diminishing returns. The balancing loops do not suddenly “appear.” They are almost always present from the very start. When the dynamic changes from one of rising growth to a slowing pace, the force driving the system has simply shifted from a reinforcing to a balancing loop. “Saturation” occurs in both cases — whether it is the saturation of a given market or the full utilization of a specific capacity.
Breaking the Law
If you find yourself “caught” by the law of diminishing returns, using a structural diagram may help you identify the critical factors and ford a way to break out of it. In a diffusion dynamics case, for example, quantifying and measuring each of the different pieces of the diagram may help decide whether you should try to expand the pool of potential adopters, segment adopters into different categories, beef up the advertising budget, or push on direct sales efforts.
In the more general case of capacity limits, breaking out of the diminishing returns phenomena requires identifying the accumulator(s) that are operating at or near full capacity and calculating what the true workload demand is. Eliminating any gaps between demand and capacity is likely to produce more results than simply pushing harder on the reinforcing loops in the system.