Throughout my 17 years as an executive in various hospitals and healthcare systems, systems thinking has become an increasingly important element in my work. Recently, I had the opportunity to leave the hospital sector and become president of a homecare company. Like the ancient Chinese curse, I got what I wished for—an opportunity to enter a young company “clean” and start a strategic planning cycle that incorporated a systems approach from the start. What I didn’t expect to find were differing viewpoints held by the key decision makers in the company.
The explosive growth in the homecare industry helped this particular company go from $0 to $10 million in revenue between 1989 and 1991. From ’91 to ’92, however, revenue plateaued and the company lost a major hospital account. When I came on, I needed to learn what was happening in the company and reestablish the growth pattern set in the previous years.
Challenging Mental Models
As a starting point, I began to explore the different viewpoints held by the company’s key players. Corporate management and the board of directors had opposing visions and ideas that required reconciliation in order to make progress. The board of directors saw only one problem — an inability to sell new hospital contracts. Consequently, they believed that if the company could solve the problem of selling, everything else would “work itself out.”
Management, however, saw the problem in terms of fundamental weaknesses in the company’s underlying operation and infrastructure. They believed that these weaknesses, such as internal capacity constraints, were being masked by flat volume and would become much more evident once the company began to grow again. Ironically, the growth that the board prayed for every day was management’s biggest nightmare.
To prepare the board and management for the systems work, I needed to convey several ideas. First, that the nature of progress isn’t necessarily linear but discontinuous, and, as with learning, you can hit plateaus or take giant steps. Many organizations do not grasp this concept of learning and instead follow a behavior pattern that assumes a linear, constant developmental path. I also needed to convey that there can be multiple “right” paths for strategy, and different combinations of strategies and tactics can conceivably get you to your goal. Finally, to set the framework, I had to illustrate that individual strategies can reinforce each other, cancel each other, or balance each other. Therefore, the strategies need to be viewed as interdependent, and the analysis must take into account how any two or more strategies interact.
Service Volume
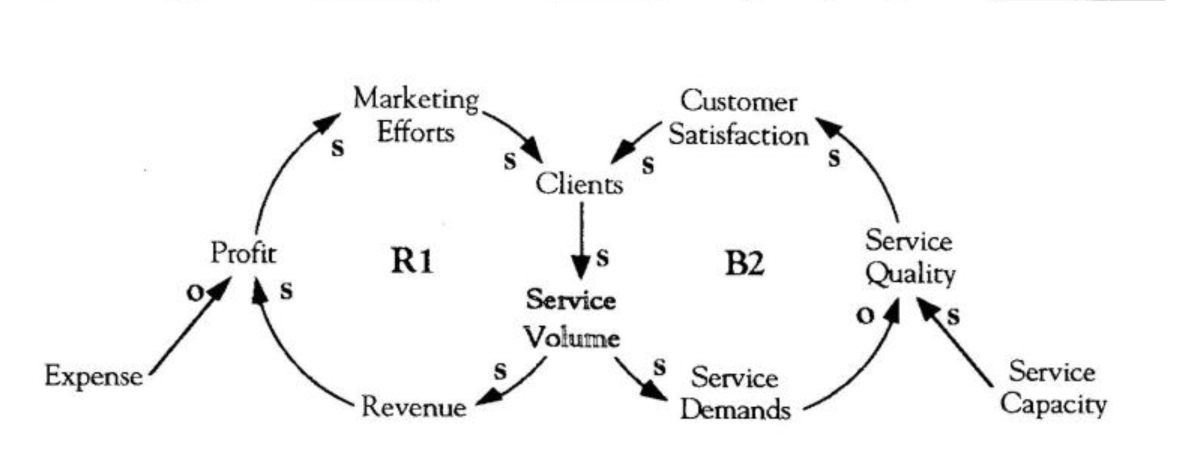
By increasing service volume, service demand will also rise. If demand grows and capacity doesn’t, service quality will drop, resulting in a smaller client base (B2). In order to keep customer satisfaction and sales high, service capacity must grow at the same pace as service volume. Higher service quality will ten lead to higher customer satisfaction, which will maintain or expand service volume, revenue, and profits.
Designing the Process
We wanted to incorporate a strategic planning process with certain primary specifications. First, the process needed to help us gain a basic systems-level understanding of how our clients are generated and how they interact with us. It also needed to enable us to explicitly play through alternative scenarios, while letting us treat strategies as dynamic and interdependent, thus allowing us to model the strategies in various ways over time.
Keeping with this criteria, we felt that an approach using systems principles and computer simulation using ithink™ software would work best. We chose this strategy because it would require a strong understanding of basic business dynamics and would allow little room for ambiguity. It also allowed for explicit definition and debate of underlying assumptions. We wanted to go through a process that included early dialogue to lay out every assumption we were making about both the way the industry was moving and the way our company functioned. Finally, this approach allowed us to generate “real-time” learning and hypothesis-testing, which we achieved by manipulating our assumptions in real time in an interactive computer-based ithink™ model.
Modeling the Macro View
We started by modeling a macro view of the company and its strategy using causal-loop diagramming. This macro view included assumptions regarding how clients are generated and how the financial and operating systems of the company function. Our primary goal was to frame and illustrate the major issues in a simple one-page strategy for the company. We also wanted to high-light interdependence among the different strategics that had been proposed within the company. The team that worked on the causal loops was a subset of seven senior managers in the company who had the best embedded knowledge of the company.
The causal looping took place in a two-step process. The team knew that the board’s fundamental issue was marketing, so it started by modeling the marketing function and then looking for all of the second-stage implications that might emerge. Suppose, for example, that we are successful in marketing. Would marketing alone be sufficient to successfully move the company forward? The board’s logic was that the marketing program would generate more clients, more clients would generate more service volume, and more service volume would generate more revenue. With reasonable expense control, the result would be higher profits. The board liked that plan and wanted to keep it that way.
As we drew the causal loop diagrams, however, I posed a question — “What would happen to our service volume if we boosted marketing efforts?” (see “Service Volume”). Marketing efforts will drive more service volume. If demand grows and capacity doesn’t, service quality will drop, which will ultimately reduce our client base (B2). The key is to turn this balancing loop into a reinforcing process. If service demand grows and service capacity keeps pace, service quality will be maintained or actually increase over time. If that happens, higher service quality will lead to higher customer satisfaction, which will maintain or expand service volume, revenue, and ultimately profits (R1).
Measuring Performance Standards
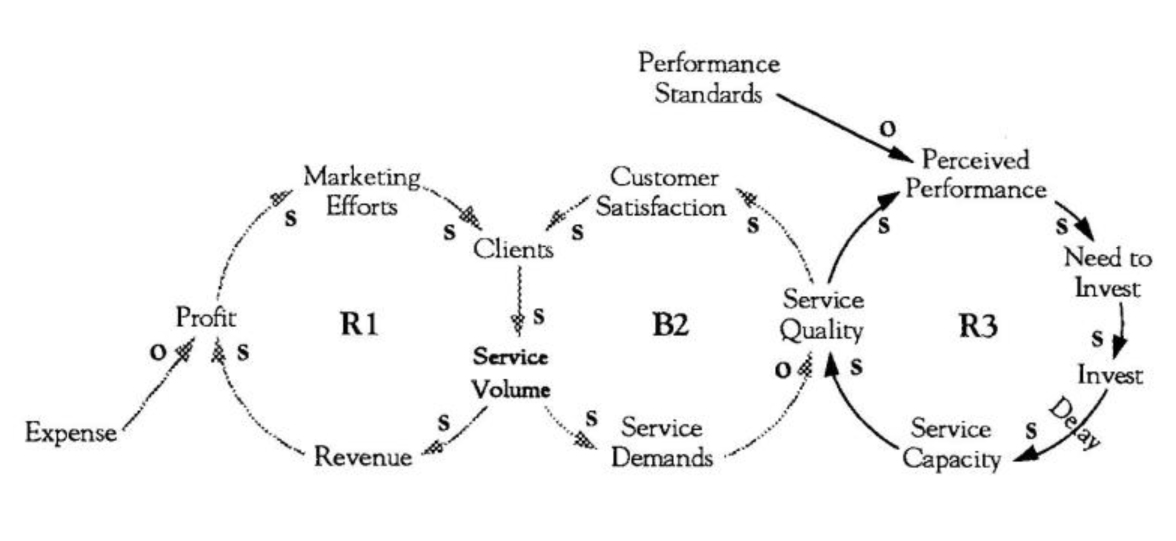
A gap between performance standards and perceived performance drives investment in service capacity, which will improve quality and lead to higher customer satisfaction (R3).
This way of thinking produced new insight for the board: a marketing program is important, but building service capacity is equally critical. We needed to invest in capacity immediately to anticipate and meet service needs. The next step, therefore, was to determine what drives service capacity. Our theory was that we operate based on something we call “perceived performance,” in which we are driven by our measures of service quality against some realistic standard. The company doesn’t have well-developed standards beyond the usual measurements of cost per case, cost per visit, and other basic economic standards. Therefore, without well-defined operating standards, we had no realistic understanding of our perceived performance.
Consequently, we were brought to the question of how to drive realistic performance standards. We concluded that we needed a formal learning program under the rubric of Total Quality Management. The belief was that our perceived performance should drive a steady investment chain in process improvement, while also inciting a greater need to study business processes (see “Measuring Performance Standards”). A gap between performance standards and perceived performance would then spur further investments in service capacity, which would raise the overall service quality (R3), leading to higher customer satisfaction and an increase in service volume. With this systemic understanding, we felt comfortable endorsing the creation of a structured program in order to create knowledge that would reinforce and refine the performance standards.
We went to the board with a plan to operationalize their vision by investing in four areas: marketing, service capacity, a rigid set of performance standards, and an organizational learning approach that would drive the kind of knowledge that sets the standards. The result was that the board and our management group began to understand that there was far more than one barrier to success in the company.
The board then challenged management with an acid test: based on the systems logic, they decided to allocate some money up front to start work on building capacity. They would not approve the full program, however, unless we demonstrated that we could deliver on selling new accounts.
We found that the easy part was adding accounts. The much harder part was the other three objectives: building capacity, creating credible performance standards with that reorganization, and instituting a TQM program throughout the company. These other aspects absorbed the vast majority of our time.
For the first three to four months, my time was spent mostly on marketing and partially on systems thinking. We were able to get over the initial threshold, proving that marketing was the apparent and not the real problem. When the board saw two signed contracts within four months, they were more willing to invest in the next stage of development. The next stage of work involved building an operational model of the company, which we used to develop and test our mix and timing of strategies. The model reinforced our understanding of the need for multiple, integrated initiatives to reach our goals.
Company Learning
Through the planning process, we realized that as a company we were not nearly as good as we thought we were. This was partly because there was little history of planning in the company. Previous strategy had been developed by the board, was very top-down, and had no involvement of the operating staff. Because strategy started and ended at the level of the board and executive management, it never found its way to the operating managers who represented 95 percent of our staff and 100 percent of our revenue. It also involved little understanding of the hospital client.
Another major reason for our performance shortfall was that the board had little exposure to the operational reality of the company. The radically different perceptions held by the board and management about future prospects and risks came about because the managers were much more grounded in the reality of the company, but they had no way to communicate that reality to the board. Although the managers could easily point out the systems that weren’t working, the measurements we weren’t doing, and the level of understanding about our core business we didn’t have, that knowledge was not being transferred to the policymakers. Our systems thinking work provided a forum and a language to stimulate that communication.
Until we started asking these questions and modeling our assumptions, many people in the company did not understand certain aspects of the business — such as how a new client was acquired (see “From Causal Loops to Simulation”). For all practical purposes, our clients “materialized out of a cloud.” So what we tried to do was work back from that cloud and really educate everyone in the company about the operational realities. Through that process, we learned a great deal about our company and our client institutions. As a result of the planning process and our work with systems thinking, we have reached a better understanding of our business and a new way of communicating and testing the complex strategies necessary for future success.
Steven DeMello was president and chief operating officer of Alliance Home Care Management, Inc. I le is presently the director of healthcare practice for High Performance Systems, Inc.
Editorial support for this oracle was provided by Anne Cycle.
From Causal Loops to Simulation
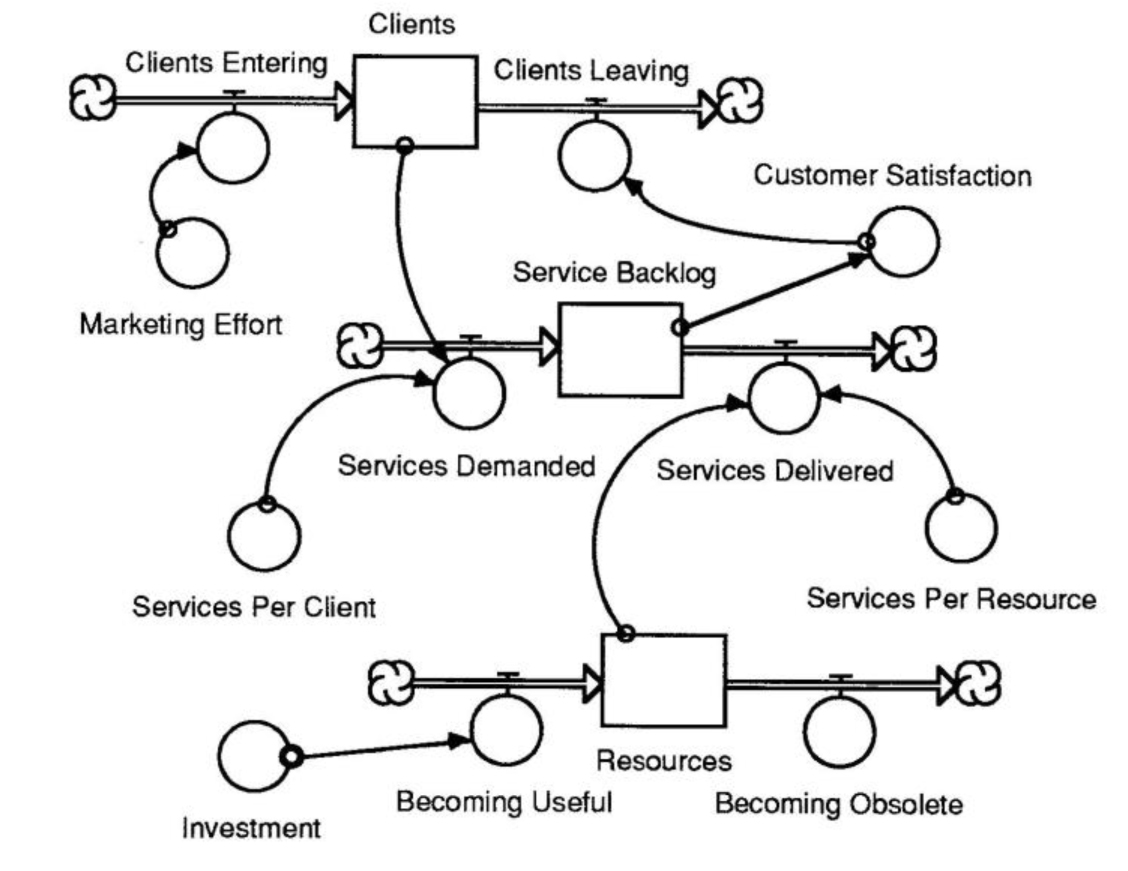
As we worked through the strategy, we found that some people responded well to causal loops, while others preferred structural mapping, particularly the use of stocks and flows. We fried to give people two different looks at some of the same issues, hoping that they could grasp some of the underlying principles through the process. We did this by first building a simple systems map using non-runnable, non-quantitative ithink™ models that laid out basic business logic, and then taking these basic maps and converting them with data into a functional operating model of the company. When we simulated our ideas, the goal was to put reality into the hypotheses, first by starting with real operating numbers from the company at the time, then moving to ‘real-time’ testing of assumptions and strategies. We simulated environmental assumptions as well as the strategies that we had looped and framed in our initial, basic modeling work. Causal loops told strong ‘visual stories;’ while ithink™ mopping and modeling brought the concrete ‘mechanics’ of the business alive in both visual and quantitative ways. This, for example, is an ithink™ map of the same issues captured in the causal loop diagram on page 7.