We all face an onslaught of information daily. We use some of that information to learn and make inferences. As we do so, it helps to know about and avoid potential blind spots. In the following article, I point out some of these blind spots. I will use several examples taken from the reports and analyses of the Challenger and Columbia space shuttle disasters, not because I wish to criticize the U. S. National Aeronautics and Space Administration (NASA), but because information is publicly available about those two events. Private organizations that have the same kinds of problems do not make them public.
Traps in “Learning from Failure”
TEAM TIP
When evaluating an initiative’s success or failure, be careful not to fall into the inferential traps described in this article.
The April 2011 issue of the Harvard Business Review was devoted to “learning from failure.” Little was said, though, about the potential traps embedded in studying failures and drawing conclusions about their causes. More than a decade earlier, in 1998, Ian Bradbury and I published a paper titled “Improving Problem Solving” (Report No. 167, Center for Quality and Productivity Improvement, University of Wisconsin). In it, we discuss two examples that illustrate the inferential traps involved in studying only failures or defects. The first example came from the Challenger disaster. In a teleconference the evening before the launch, Thiokol solid rocket booster engineers argued that the launch should not proceed due to the low ambient — and hence joint — temperature. Project leaders however considered the argument made by Thiokol personnel too weak to support a decision to delay the launch.
CHALLENGER O-RING PROBLEM DATA
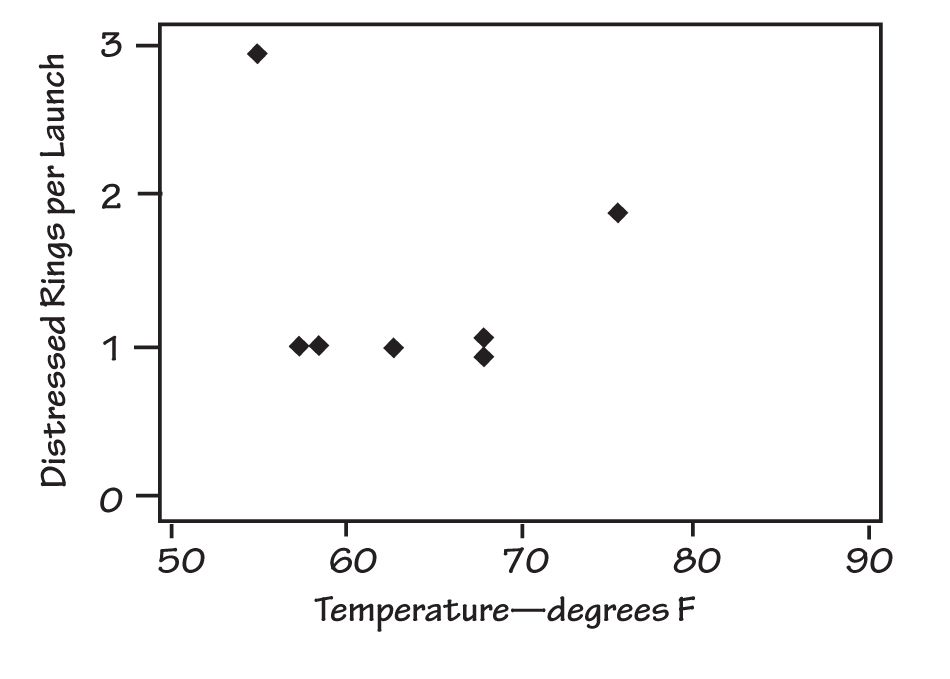
During a teleconference the evening before the Challenger launch, only two of the points on the plot received much attention: the point at 55° F and the one at 75° F.
The data reviewed in the discussion included the occasions on which problems had previously occurred with O-rings on the solid rocket boosters and the temperatures at which these problems had occurred. See “Challenger O-Ring Problem Data” for a plot of the number of distressed rings per launch versus booster joint temperature. During the teleconference, the data were not displayed graphically, and only two of the points on the plot received much attention: the point at 55º F and the one at 75º F.
The team never discussed instances in which the number of distressed O-rings (called “failures” for purposes of this discussion) was zero. That is, the discussion considered only failures. Subsequent to the disaster, a plot was made that included the launches that had no distressed O-rings (see “Complete Challenger O-Ring Data”).
COMPLETE CHALLENGER O-RING DATA
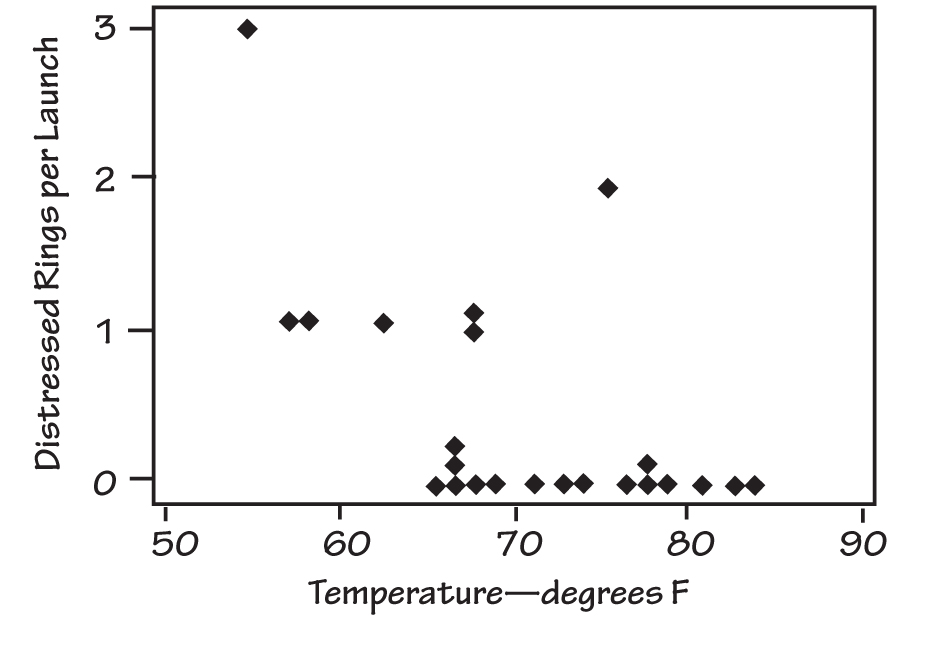
Subsequent to the disaster, a plot was made that included the launches that had no distressed O-rings.
Adding the information about launches in which there were no distressed O-rings changes one’s view of the relationship between failures and temperature, particularly considering that the projected launch temperature was near freezing. Since the accident, some have argued that had the second graph been discussed in the teleconference, it might have carried the day and led to a postponement of the launch (see, for example, Diane Vaughan, The Challenger Launch Decision, University of Chicago Press, 1996). Edward Tufte makes the case that a clear proximate cause of the accident was “[A]n inability to assess the link between cool temperature and O-ring damage on earlier flights. Such a prelaunch analysis would have revealed that this flight was at considerable risk” (Visual Explanations: Images and Quantities, Evidence and Narrative, Graphics Press, 1996).
Tufte discusses the 13 charts that the team used during the teleconference and concludes, “[T]here is a scandalous discrepancy between the intellectual tasks at hand and the images created to serve those tasks. As analytical graphics, the displays failed to reveal a risk that was in fact present. As presentation graphics, the displays failed to persuade government officials that a cold-weather launch might be dangerous. . . . [T]here are right ways and wrong ways to show data; there are displays that reveal the truth and displays that do not. And, if the matter is an important one, then getting the displays of evidence right or wrong can possibly have momentous consequences.” (It is not my intention here to discuss visual displays, but rather to advocate the use of all the data pertinent to the issue at hand in drawing conclusions. However, I recommend Tufte’s books, including his landmark Visual Display of Quantitative Information, to all of us who analyze and present information.) Tufte actually identifies two problems here: first, the omission from the discussions of the prior launches that did not have distressed O-rings, and second, the inadequacy of the displays of evidence.
The second example of inferential traps that result from studying only failures comes from the automotive industry and was provided by Mike Tveite:
A manufacturer of fuel injectors had been having a problem with mild leakage. In certain cases, when the fuel injector should have been closed, small amounts of fuel were seeping past its sealing surface into the engine’s inlet manifold. This often showed up first as a lack of smoothness of the engine at idle or reduced ease of starting.
FUEL INJECTOR FAILURES
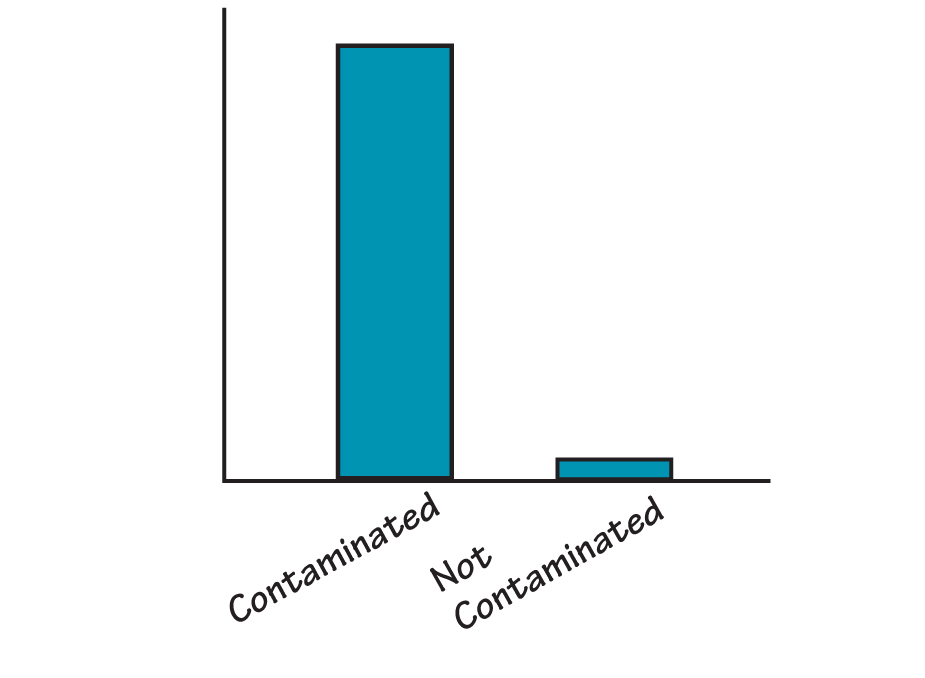
This picture is intended to convey the idea that the vast majority of failed injectors contained contamination. It is not intended to be numerically accurate.
Under the warranty agreement, car dealerships that replaced fuel injectors for being leaky returned them to the manufacturer for problem-solving analysis. Tear down of the fuel injectors and careful examination under a microscope revealed a relationship like that depicted in “Fuel Injector Failures.”
Possible actions that were being considered to reduce the level of contamination included redesign of the injector and fuel line filters; additional washing, flushing, and inspection operations in the manufacturing process; increased air filtration and so on.
The people working on the problem were asked whether they had examined any fuel injectors that were not leaky. They had not, but decided to do so. Doing so produced the result shown in “Leakage Versus Contamination.”
LEAKAGE VERSUS CONTAMINATION
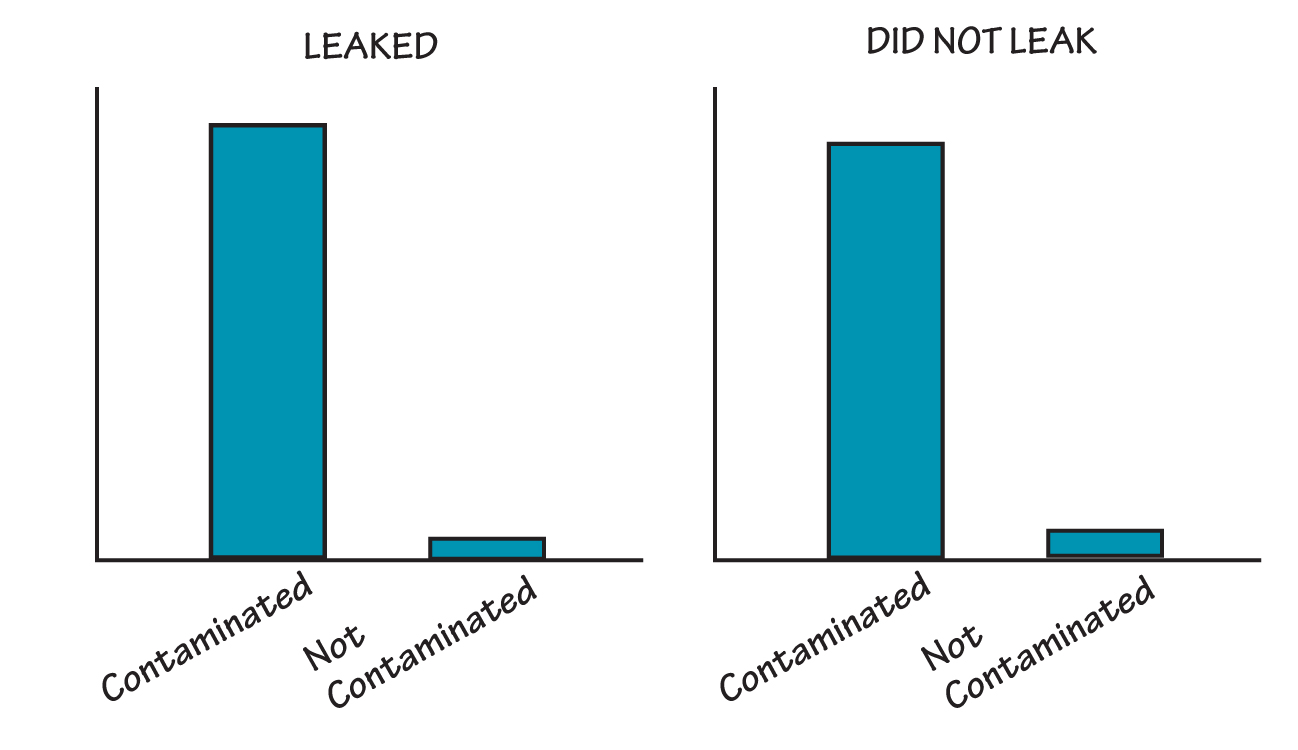
When the people working on the problem also examined fuel injectors that were not leaky, they found that contamination was present independent of the occurrence of leakage.
It thus became apparent that the contamination was present independent of the occurrence of leakage. If the manufacturer had not examined “non-defective” injectors, it could have expended substantial time and capital on reducing the presence of contamination without benefit to the problem at hand.
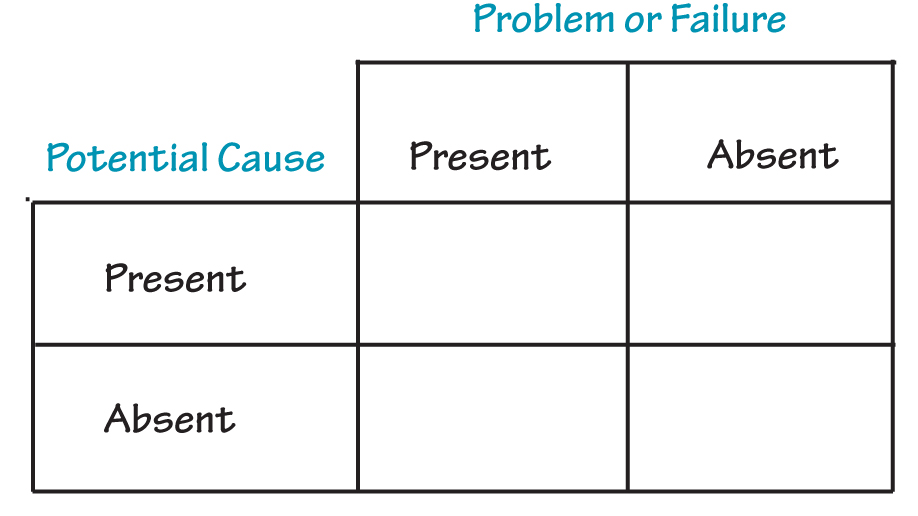
In our paper, Ian Bradbury and I note that when a potential cause is of a binary nature, that is, it is either present or absent, we must attempt to obtain data in all of the cells of a table such as the following:
Tufte puts it more generally: “In reasoning about causality, variations in the cause must be explicitly and measurably linked to variations in the effect.” He goes on to identify principles for reasoning about statistical evidence and for the design of statistical graphics: “(1) documenting the sources and characteristics of the data, (2) insistently enforcing appropriate comparisons, (3) demonstrating mechanisms of cause and effect, (4) expressing those mechanisms quantitatively, (5) recognizing the inherently multivariate nature of analytic problems, and (6) inspecting and evaluating alternative explanations.”
I do realize that I have put forth two examples of failures in learning and inference to discuss traps in learning from failure. It is likely that there are cases in which these kinds of problems existed and the parties involved reached the correct conclusions, but my goal in providing examples of these traps is to increase awareness of the potential for these failures.
Likewise, the use of “the 5 Whys” to discover “the Root Cause” of a problem, mistake, or failure is fraught with the danger of falling into the same kind of logical trap illustrated by the two preceding examples. In our paper, Ian and I go on to say, “If one only considers the ‘problem’ category of results from a system, one may either miss an important causal relationship (as in the Challenger case) or erroneously infer presence of a causal relationship,” as in the case of leaky injectors. Any analytical tool depends on the mind of the user for the goodness of its outcome.
Learning from Failures (or Successes) on a Large Scale
After the Challenger disaster, a commission chaired by former Secretary of State William Rogers was appointed to investigate. The U. S. House Committee on Science and Technology also conducted hearings and produced a report. Subsequently, sociologist Diane Vaughan did an intensive study of the context of the disaster and the practices and relationships that existed in the NASA system (including contractors), in the engineering profession, and in the government. After her study, Vaughan concluded that the Rogers Commission had failed to include important aspects of the context:
Both for easy public digestion and for NASA’s survival, the myth of production-oriented, successblinded middle managers was the best of all possible worlds. It removed from public scrutiny the contributions to the disaster made by top NASA officials, Congress and the White House, and it minimized awareness of the difficulty of diagnosing the risky technology. Locating blame in the actions of powerful elites was not in NASA’s interest. And focusing attention on the fact that, after all this time, the technology still could defy understanding would destroy the NASA-cultivated image of routine, economical spaceflight and with it the Space Shuttle Program. . . .
Retrospection corrects history, altering the past to make it consistent with the present, implying that errors should have been anticipated. Understanding organizational failure depends on systematic research that avoids the retrospective fallacy.
In hindsight, it is likely that an explanation can be found for any failure, and an inference can be made that the parties involved should have known better.
It is just as dangerous to restrict study to successes. Peters and Waterman’s book, In Search of Excellence, is an example. They identified some companies as “excellent.” Then they studied each company to discover why it was excellent. They picked some practices that they saw as the reasons for excellence and discussed them in the book. My friend Bill Bellows points out that they didn’t go to other companies that were not in the excellent category to see if they were also using those practices. Later, some of the companies identified as excellent were not so excellent.
From this perspective, information from benchmarking exercises should be considered carefully. Simply copying without careful thought about context and whether or not a practice will fit into an organization’s system can be dangerous.
The “Root Who”
The fundamental attribution error occurs when someone attributes a problem or mistake to the behavior of an individual without considering situational factors that may have influenced that behavior. We tend to attribute problems to the people who happened to be there when the issue occurred, rather than considering numerous other factors that may have contributed. (On the other hand, when we make a mistake ourselves, we tend to consider those other factors.)
In its August 2003 report on the shuttle Columbia accident, the Columbia Accident Investigation Board stated:
Many accident investigations make the same mistake in defining causes. They identify the widget that broke or malfunctioned, then locate the person most closely connected with the technical failure: the engineer who miscalculated an analysis, the operator who missed signals or pulled the wrong switches, the supervisor who failed to listen, or the manager who made bad decisions. When causal chains are limited to technical flaws and individual failures, the ensuing responses aimed at preventing a similar event in the future are equally limited: they aim to fix the technical problem and replace or retrain the individual responsible. Such corrections lead to a misguided and potentially disastrous belief that the underlying problem has been solved. The Board did not want to make these errors.
I recall hearing an executive in a large corporation refer to “the ongoing search for the root who.” Others refer to the kind of faulty investigation described by the Board as “the Blame Game.” When this kind of activity goes on in an organization in response to a failure, learning is suppressed. To avoid the Blame Game requires practice of the discipline of thinking about context, i.e., thinking systemically.
Superstitious Learning
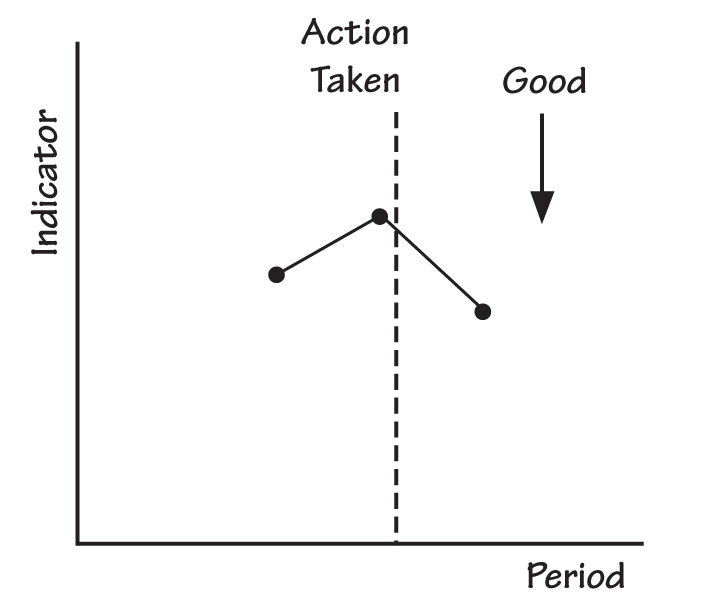
People at all levels in organizations watch performance indicators. When the indicators get worse from one period to the next, employees often act to correct the situation. If a given performance indicator then gets better the next period, the actors conclude that their actions produced the improvement. I have attempted to illustrate the connection of the conclusion to the results in “An Action Appears to Produce Improvement.”
AN ACTION APPEARS TO PRODUCE IMPROVEMENT
PERFORMANCE INDICATORS PLOTTED OVER TIME
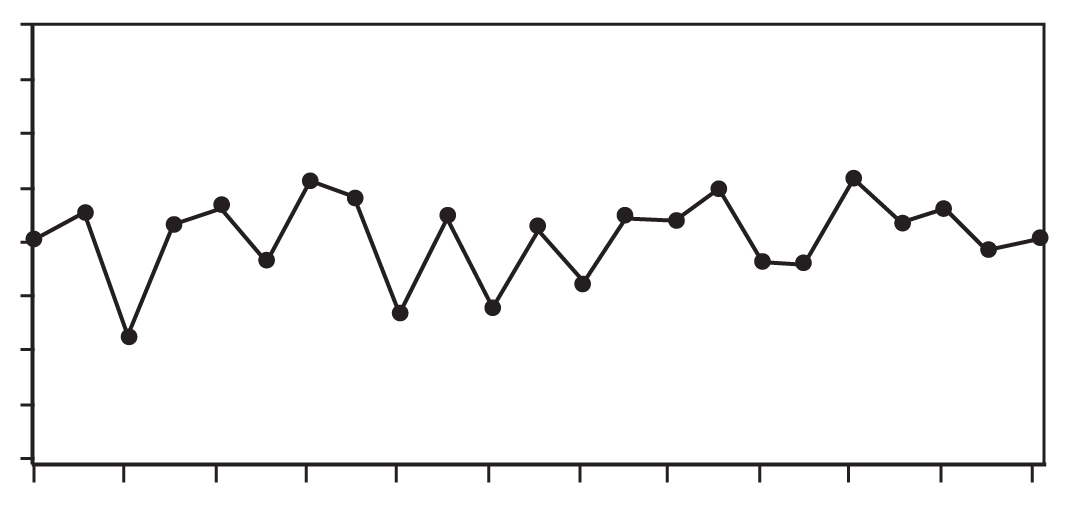
However, it is possible that the action had no immediate effect. In Experiences in Statistics, using a mathematical model for stable variation, Dr. Dennis Gilliland demonstrated that the likelihood that the third number pictured would be lower than the second given the second was higher than the first was two thirds. (The same likelihood would exist for the third number in a sequence high-low-high). This finding means that when the action has no effect at all, the person who acted would be more likely to conclude that the action produced an improvement even when it didn’t. Plotting performance indicators over time would reduce the chance of this kind of superstitious learning. In “Performance Indicators Plotted Over Time,” notice that the first three points in the series follow the pattern shown above, as do points four, five, and six, as well as other sequences of three points in the series.
The Dangers of Induction
W. Edwards Deming stated in The New Economics, “No number of examples establishes a theory, yet a single unexplained failure of a theory requires modification or even abandonment of the theory.” Deming’s statement implies that you can pile up empirical examples that appear to support a theory from here to the moon, but that does not constitute proof. Our degree of belief that the theory is correct may increase, but we have not proved that the theory will hold up in the future. Inductive proof can be done in mathematics, but not in the world of experience. Deming used the example of the mythical rooster Chanticleer to explain what he meant by the statement above:
The barnyard rooster Chanticleer had a theory. He crowed every morning, putting forth all his energy, lapped his wings. The sun came up. The connexion was clear: His crowing caused the sun to come up. There was no question about his importance. There came a snag. He forgot one morning to crow. The sun came up anyhow. Crestfallen, he saw his theory in need of revision. Without his theory, he would have had nothing to revise, nothing to learn.
If Chanticleer had been a two-year-old rooster, he would have had nearly 500 observations that appeared to support his theory. However, those 500 observations did not prove the correctness of his theory. As another example, think of the many centuries during which our species collected empirical observations that were consistent with the theory that the sun revolved around the earth. Nevertheless, Milton Silviera, Chief Engineer, NASA, wrote, “The first flight [of the shuttle] represented a proof of the design concept.” I am not sure of the meaning of his statement, but I’m certainly unsure that the word “proof” is appropriate to describe one observation, successful though it might have been.
Before using a theory in a new, possibly untested circumstance, good practice requires carefully examining the test conditions.
In his important book, The Structure of Scientific Revolutions, Thomas Kuhn describes the doing of science as puzzle-solving within the current scientific paradigm until anomalies occur that force scientists to reexamine their basic theory and develop new theories that provide the ability to explain the anomalies. Diane Vaughan observes, “In the Kuhnian sense, a paradigm is a fundamental component of scientific culture. It is a worldview based on accepted scientific achievement, which embodies procedures for inquiring about the world, categories into which these observations are fitted, and a technology that includes beliefs about cause-effect relationships and standards of practice and behavior.”
In the engineering disciplines, when it is extremely costly or virtually impossible to construct tests of ideas, it may be tempting to rely on a series of observations in practical application as “proof.” This appears to have happened in the case of the Challenger. Vaughan writes,
From integrated sets of assumptions, expectations, and experience, individuals construct a worldview, or frame of reference, that shapes their interpretations of objects and experiences. Everything is perceived, chosen, or rejected on the basis of this framework. The framework becomes self-confirming because, whenever they can, people tend to impose it on experiences and events, creating incidents and relationships that conform to it. And they tend to ignore, misperceive, or deny events that do not fit. As a consequence, this frame of reference generally leads people to what they expect to find. Worldview [paradigm] is not easily altered or dismantled because individuals tend ultimately to disavow knowledge that contradicts it. They ward off information in order to preserve the status quo, avoid a difficult choice, or avoid a threatening situation. They may puzzle over contradictory evidence but usually succeed in pushing it aside—until they come across a piece of evidence too fascinating to ignore, too clear to misperceive, too painful to deny, which makes vivid still other signals they do not want to see forcing them to alter and surrender the worldview they have so meticulously constructed.
So we see that a complex set of cognitive, psychological, and logical forces may lead us to unwarranted induction. It is important to be aware of this tendency and try to practice a discipline of being careful about our inferences. It is also useful to keep in mind that, as Clarence Irving Lewis noted in Mind and the World Order, empirical generalizations are “probable only.” The next observation may overturn the generalization. As Deming said in Out of Crisis, “No matter how strong be our degree of belief, we must always bear in mind that empirical evidence is never complete.”
Limits of Applicability of a Theory
In January 2003, the space shuttle Columbia was launched. During the launch, a block of foam insulation struck the leading edge of Columbia’s left wing. This strike damaged Columbia’s thermal protection system and led to disintegration of the shuttle as it re-entered the earth’s atmosphere. In work done to assess the potential damage while the shuttle was still in orbit, analysts used a mathematical modeling tool called Crater. Crater was normally used to predict whether small debris, such as ice on the external fuel tank, would pose a threat during launch. Crater had been calibrated with testing done on small debris on the order of three cubic inches. People at NASA judged Crater to be a conservative tool; that is, it tended to predict more damage than actually occurred.
In the discussion of the Crater model, the Columbia Accident Investigation Board stated:
Although Crater was designed, and certified, for a very limited set of impact events, the results from Crater simulations can be generated quickly. During STS-107 [the Columbia mission], this led to Crater being used to model an event that was well outside the parameters against which it had been empirically validated. . . . [M]any of the STS-107 debris characteristics were orders of magnitude outside the validated envelope. For instance, while Crater had been designed and validated for projectiles up to 3 cubic inches in volume, the initial STS-107 analysis estimated the piece of debris at 1200 cubic inches — 400 times larger.
The Board concluded that “the use of Crater in this new and very different situation compromised NASA’s ability to accurately predict debris damage in ways that Debris Assessment Team engineers did not fully comprehend.”
Usually, it is advisable to avoid use of a theory or model to apply to a set of circumstances that are outside the test boundaries. Therefore, before using a theory in a new, possibly untested circumstance, good practice requires carefully examining the test conditions. In a personal communication, Ian Bradbury pointed out that we face an inferential gap in cases such as validation testing with prototype parts (differing materially from the intended method of production) and test conditions that differ materially from intended use. He states, “Deliberate consideration of the theory behind the Crater model with subject matter knowledge could have assisted in the judgment of likely effectiveness for the intended inference. Efforts previously to empirically test the limits of model applicability against predictions from underlying theory would have been better still.”
Theories and Assumptions Not Made Explicit
In The Logic of Failure, Dietrich Dörner writes:
If we want to operate within a complex and dynamic system, we have to know not only what its current status is but what its status will be or could be in the future, and we have to know how certain actions we take will influence the situation. For this, we need “structural knowledge,” knowledge of how the variables in the system are related and how they influence one another. . . . The totality of such assumptions in an individual’s mind — assumptions about the simple or complex links and the one-way or reciprocal influences between variables—constitute what we call that individual’s “reality model.” A reality model can be explicit, always available to the individual in a conscious form, or it can be implicit, with the individual himself unaware that he is operating on a certain set of assumptions and unable to articulate what those assumptions are. Implicit knowledge is quite common. . . . An individual’s reality model can be right or wrong, complete or incomplete. . . . The ability to admit ignorance or mistaken assumptions is indeed a sign of wisdom.
In the example of the use of Crater, it appears that the NASA team implicitly assumed that the model performed the same both in the test conditions and when the piece of debris striking the Columbia was 400 times larger. Had this assumption been made explicit, perhaps someone would have asked for an explanation of the rationale behind the assumption. Any conclusions drawn from the analysis should have been qualified by a statement of the conditions under which Crater was tested.
The more we work at trying to identify the traps awaiting us, the more adept we may become at overcoming them.
People also use implicit theories in less technical circumstances. For example, Douglas McGregor articulated Theory X and Theory Y to describe views about the nature of people in the workplace. In the management of organizations, implicit theories about the value and effects of competition, the nature and sources of motivation, the relationships among organizational components, and many other aspects of the organization’s functioning govern management’s actions every day. Individuals and organizations could learn and improve by bringing their assumptions and theories to the surface and questioning them.
Doubtless there are other blind spots that can introduce difficulties into learning and inference. The more we work at trying to identify the traps awaiting us, the more adept we may become at overcoming them.
Gipsie Ranney is an international consultant to organizations on management, quality improvement, and statistical methodology. She was a co-founder of the University of Tennessee’s Institute for Productivity through Quality. Gipsie co-authored Beyond Total Quality Management: Toward the Emerging Paradigm and contributed to Competing Globally Through Customer Value. The American Society for Quality awarded her the Deming Medal in 1996 “for outstanding contribution in advancing the theory and practice of statistical thinking to the management of enterprises worldwide.”