The behaviors of all ecological and human systems result from cause-and-effect links that make up reinforcing (positive) or balancing (negative) feedback loops. Generally speaking, reinforcing loops produce expansion or decline that escalates over time—known as exponential growth or collapse. Balancing loops maintain stability. Reinforcing loops are at the heart of such common phenomena as compounding interest, rising productivity, and population growth.
But no exponential growth process can continue forever. A system that is dominated by reinforcing loops will quickly encounter one or more limits. These limits will eventually cause some balancing loop to become dominant, a process known as shifting dominance. By better understanding reinforcing processes and shifting dominance, practitioners can more easily detect them in their early stages and intervene appropriately before they spiral out of control.
Purpose
Participants engage in this exercise to:
- experience some important physical features of a process that exhibits doubling and exponential growth
- confront the phenomenon of shifting dominance
- practice drawing and interpreting behavior over time graphs and causal loop diagrams.
Context
“Paper Fold” provides a wonderful illustration of the power of reinforcing processes. When we are struggling to help our clients or audience understand the behavior of some reinforcing loop that resides at the heart of a relevant issue, we often find it useful to take five minutes to do this activity. We like this exercise in part because of its simplicity and portability. If presented in the spirit of inquiry, exploration, and playfulness, “Paper Fold” can help participants confront their own misperceptions about causality and exponential growth in a nonthreatening way.
Equipment and Set-up
You need one small cocktail napkin or paper-towel square for each participant. A sheet of regular typing paper is too thin to work well.
If you don’t have enough napkins for everyone, you can hold one up and demonstrate folding it as outlined below. However, having people watch the exercise rather than experience it for themselves may reduce its impact.
Instructions
Instruct the group to do the following: “Take the napkin (or paper-towel square). Fold it in half, fold it in half again, and fold it in half again. Now fold it in half a fourth time. After four folds, it is about 1 cm or a 0.4 inch thick.” Continue, “Of course, you could not fold the napkin in half 29 more times. But if you could, how thick would it be?”
Because the answer to this question is highly counterintuitive, most people will not know it. To stimulate discussion, we suggest a number of different thicknesses and ask participants to raise their hand for the answer that seems most reasonable. For example, we say, “Who thinks it would be less than a foot thick? How about from the floor to the ceiling? How about from here to the top of the building?” Then we share the correct answer: “Folded 29 more times, this napkin would be 3,400 miles thick, the distance from Boston, MA to Frankfurt, Germany.”
Debrief
Most participants consider the correct answer totally preposterous and assume there is a trick to it. In debriefing the exercise, we suggest first demonstrating the math behind the answer. Use slides or a white board to show the dramatic outcome of doubling anything 33 times: 1, 2, 4, 8,16, etc. Doubling something 29 times increases it by a factor of about 540 million. After four folds, the napkin is about 0.4 inches thick. Doubling it 29 more times would produce a thickness of 216 million inches. A mile is about 63,400 inches, so the folded napkin would be a little over 3,400 miles thick.
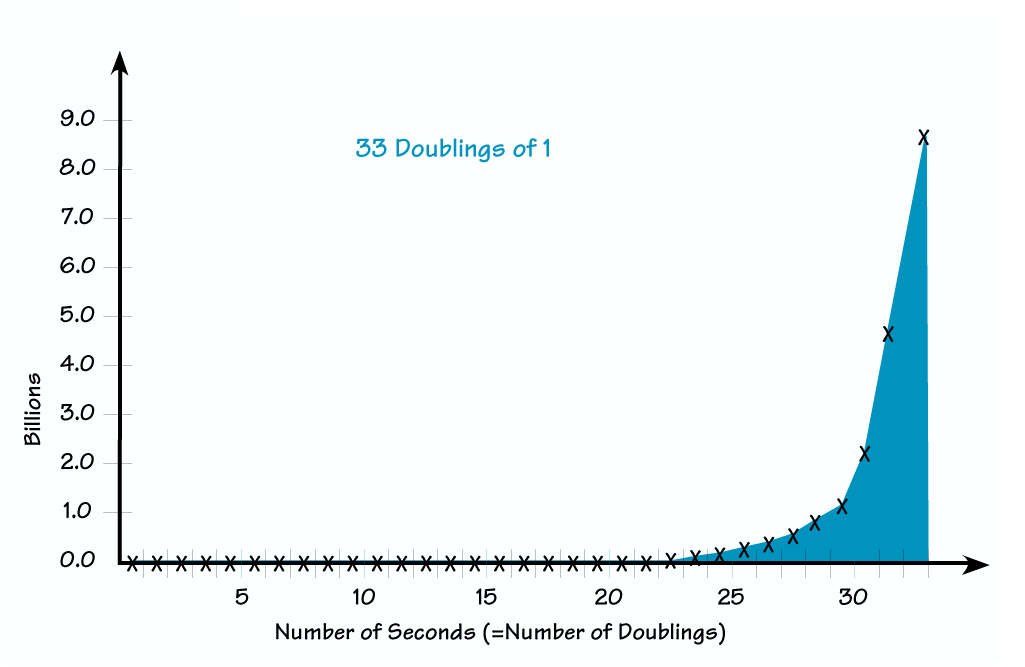
At this point it is useful to ask people to draw the behavior over time graph for the thickness of the napkin, assuming that they could accomplish one fold every second for 33 seconds.
Depending on the time available, you may want to prepare other examples to further explore this dynamic. Population growth is a dramatic illustration that piques people’s interest. You can say, “We chose to illustrate 33 doublings in this activity for a reason. Today’s global population is almost 33 doublings from the first person on Earth. More than 6 billion people currently live on the planet. In other words, an individual relates to the planet’s population as the thickness of a single sheet of paper relates to the distance from Boston to Frankfurt.”
A traditional French riddle also illustrates the surprising nature of exponential growth: Suppose a water lily is growing on a pond in your backyard. The lily plant doubles in size each day. If the lily were allowed to grow unchecked, it would completely cover the pond in 30 days, choking out all other forms of life in the water. For a long time, the plant seems small, so you decide not to worry about cutting it back until it covers half the pond. How much time will you have to avert disaster, once the lily crosses your threshold for action? The answer is, “One day.” The water lily will cover half the pond on the 29th day, leaving you only 24 hours before it chokes out the life in your pond.
The behavior in all of these instances seems counter-intuitive. We generally expect things to follow linear patterns of growth. Linear growth occurs whenever a factor expands by a constant amount each time period. But positive feedback causes a factor to expand by a constant percentage each time period. In this second case, the change process starts slowly; in folding the napkin, no significant change is noticeable for many doublings. Then, although the underlying growth process hasn’t changed at all, an explosion seems to occur. The 34th doubling would actually add another 3,400 miles to the napkin’s thickness, as much as has accumulated throughout all past history.
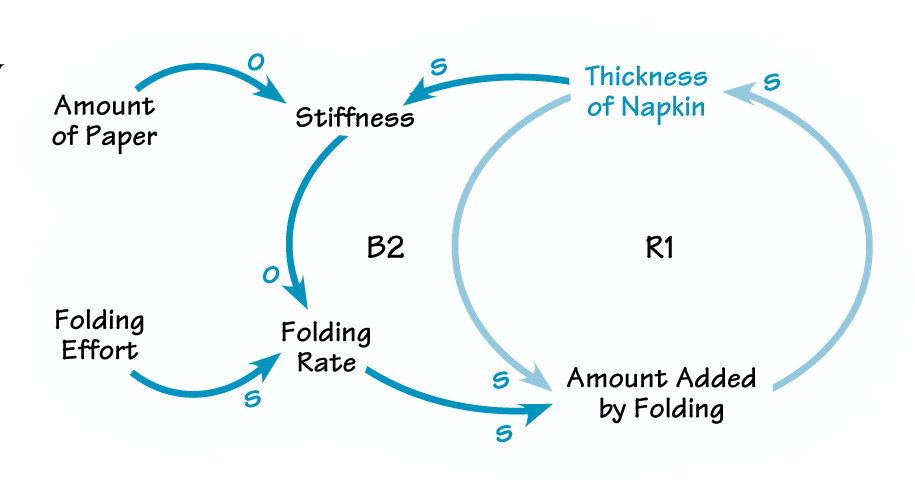
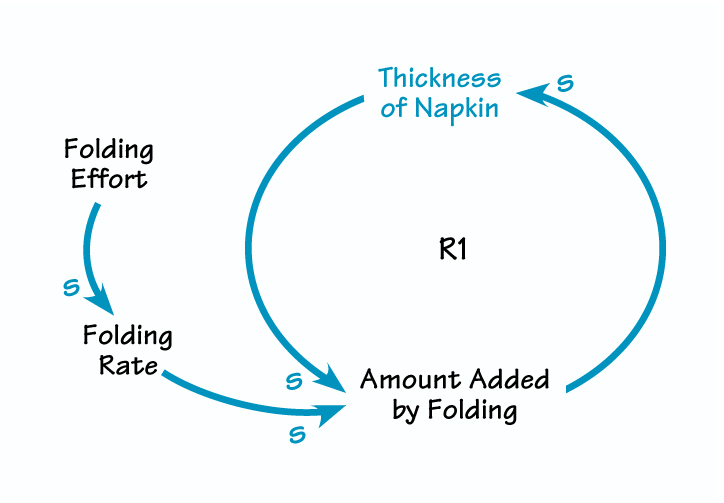
To understand this behavior, it is useful to show a causal loop diagram of the underlying loop structure. If you have time, ask participants to work together in small groups to draw the simplest possible diagram that explains the growth in the napkin’s thickness.
Here, R1 is the dominant loop. For a constant folding rate, the greater the thickness of the napkin, the greater the amount added by folding. As the amount added by folding goes up, the thickness of the napkin increases as well.
Variation
If you have time, create two-person teams. One person folds and the other plots the thickness on a simple behavior over time chart, with the number of seconds (assuming one fold per second) on the horizontal axis and the thickness of the napkin on the vertical axis.
Did the groups’ behavior over time graphs look like the figure on p. 5? Obviously not. The teams find that it is impossible to fold the napkin more than seven or eight times. At that point, the thickness stops growing. The exponential growth plateaus once you can no longer fold the napkin What causes this behavior? The answer is: shifting dominance.
Initially, change in the napkin’s thickness is influenced only by the reinforcing loop (R1). At that point, growth in the napkin’s thickness does not produce any palpable increase in its stiffness. But as the thickness increases, the stiffness starts to increase. The resistance to folding grows until no amount of human effort can produce another fold. The balancing loop (B2) has become dominant.
Shifting dominance is an important phenomenon for all managers to comprehend. When it occurs, successful policies that have been learned and refined over time no longer work; they may even become counterproductive. Management lore is full of stories about leaders who mastered one way of attaining success by identifying and pushing on the dominant reinforcing loop governing progress in their firm. But then some limit emerges, perhaps in the market or among competitors. Because the company’s data system probably focuses only on the variables in the loop that used to be dominant, management’s control systems do not even register the change. Performance eventually falters, and management’s response is to push even harder on the policy levers that used to work—to no avail. By the time there is indisputable evidence that new loops are dominant, it may be too late to avoid permanent damage. Understanding the dynamics of shifting dominance can help managers react to changing conditions before it’s too late.
Linda Booth Sweeney is a doctoral student at Harvard’s Graduate School of Education. Her research focuses on systemic innovation practices and the development of systemic thinking skills. Dennis Meadows is director of the Laboratory for Interactive Learning at the University of New Hampshire. He has co-authored eight books that illustrate the use of systems thinking to understand complex social and environmental issues.