When it comes to complex systems, things are seldom what they seem at first glance. Nowhere is this difficulty more evident than in the case of climate change. In their paper “Cloudy Skies: Assessing Public Understanding of GlobalWarming” (System Dynamics Review, 18(2), 2002), John Sterman and Linda Booth Sweeney show that highly educated graduate students performed poorly in predicting the outcomes of various scenarios around increases and decreases in CO2 emissions. The challenge, then, is finding ways to make these dynamics comprehensible to the general public.
A Stock and Flow Depiction
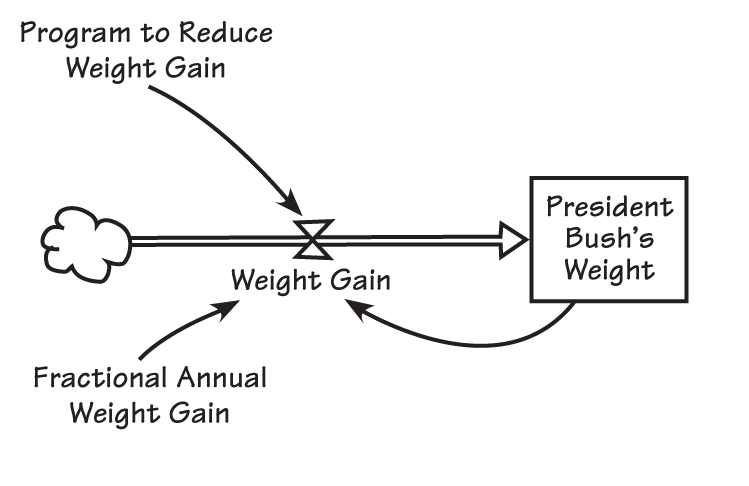
Fortunately, analogies and simple, everyday examples can help us understand what’s really going on. For instance, a common way to illustrate some of the core behaviors of systems is through the example of a bathtub. A bathtub—or a stock—is something that holds different levels of water. That level is affected by the rates at which water both enters and drains from the tub— these are know as flows. A stock can be anything that accumulates, such as money in a bank account or greenhouse gases in the atmosphere, while a flow affects the way that the stock changes over time, such as through deposits or withdrawals—of money or pollutants. Recognizing how changes in flows affect associated stocks can go a long way toward improving our decision-making processes.
An Attention-Grabbing Illustration
Weight-loss Scenario
In a recent Op-Ed piece in The New YorkTimes, columnist Gail Collins chooses an attention-grabbing image to dramatize the Bush administration’s policies on climate change—and to shed light on the stocks and flows involved. According to Collins, in a press conference in April, the president announced that the U. S. is on track for reducing the growth of greenhouse gas emissions by 18 percent by 2012. Sounds promising, until you consider what that statistic actually means.
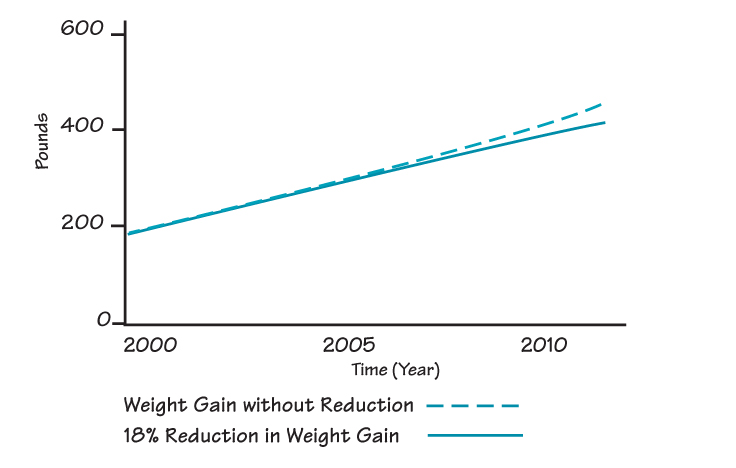
To put this goal in more tangible terms, Collins translates it into something that many of us can relate to— weigh gain. She quips, “Suppose that two years after taking office, George W. Bush discovered that because of the stress of his job, he had gained 40 pounds and was tipping the scales at 220.” If the president set a goal of reducing the rate at which he was gaining weight by 18 percent, to be achieved within the next decade, by 2012, he would weigh 400 pounds.
In the press conference, Bush made an additional commitment of stopping the growth of U. S. greenhouse gas emissions entirely by 2025. To continue with the tongue-in-cheek scenario, Collins asks the reader, “Imagine it’s 2025, and you’ve got a 486-pound ex-president being wheeled in to accept the congratulations of the world on his excellent physical fitness program.” Not such impressive results, unless the president is looking to launch a career as a sumo wrestler after leaving the White House.
Reality Check
TEAM TIP
Practice identifying the stocks (accumulation of things, such as employee head count or morale) and flows (the factors that increase and decrease stocks over time, such as hiring or levels of trust) in your organization.
Collins’s point is that, under this policy, greenhouse gases will continue to flood into the atmosphere, just a little more slowly than they might have otherwise. But without testing the implications of various strategies, we often make unrealistic assumptions about the results they may produce. We end up relying on the goodwill of politicians to spell out the effects that their policies are designed to produce—or on the media to connect the dots for us. Looking at how proposed laws, regulations, and other interventions might play out over time can help us better judge their effectiveness— and might lead us to advocate for alternative approaches instead.
Janice Molloy is content director at Pegasus Communications and managing editor of The Systems Thinker. Thanks to Bill Harris of Facilitated Systems (www.facilitatedsystems.com) for serving as a thought partner and creating the diagrams.