Feedback loops can be thought of as closed loops of interconnection; basically, sequences of mutual causes and effects. The links between each variable show how they are interconnected, while the sign or polarity of each link shows how the variables affect one another. Causal loop diagrams (CLDs) can therefore be thought of as a simplified map of the connections in a closed system of cause-and-effect relationships.
Causal Links
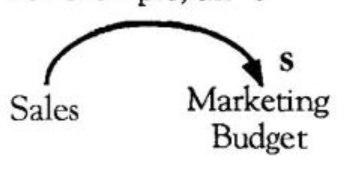
In CLDs, an “s” (or a “+”) by an arrow-head of a link means a change in the same direction. For example, an “s” link from sales to marketing budget would Sales Marketing indicate that as get sales change in any direction, the marketing budget (all else remaining the same) would move in the same direction. In other words, if sales increase, revenues for marketing would increase. If sales decrease, the marketing budget would decrease.
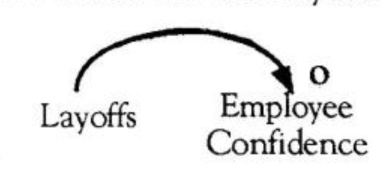
An “o” (or a “-“) by an arrowhead of a link indicates a change in the opposite direction. A causal link from layoffs to employee confidence labeled with an “o” would mean that if layoffs increase, employee confidence would decrease; or if layoffs decrease, confidence would increase (all else remaining the same).
Exponential Growth…
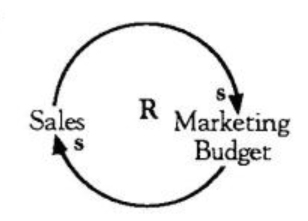
One of the building blocks of feedback systems is the reinforcing loop. Reinforcing loops have several characteristics. They are self-reinforcing, which means they compound change in one direction with even more change. Unstopped, they continue to reinforce a particular behavior. For example, if we add another link from marketing back to sales in our previous example, as sales increase, revenue to invest in marketing increases, which can lead to a further increase in sales. This particular diagram has two “s” links.
…And Collapse
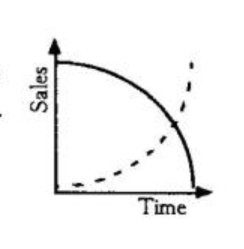
Reinforcing loops don’t always mean growth, however. The same reinforcing structure that creates growth can also produce collapse. For example, as sales drop, revenues available to invest in marketing or sales staff also decreases, leading to a further decrease in sales.
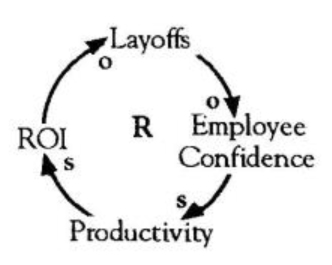
It is important to note that reinforcing loops do not have to be made up of all, or even any, “s” links. For example, as a company’s layoffs increase, employee confidence decreases, leading employee productivity to drop off and company ROl to drop, eventually leading to more company layoffs. This diagram has two “o” links and two “s” links, so it is a reinforcing loop.
Identifying Reinforcing Loops
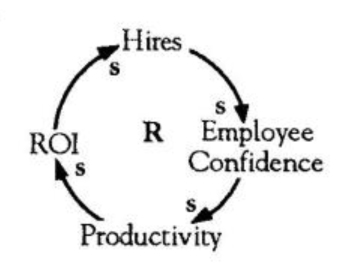
Suppose you change a term and the sign of that link changes — what was once an “o” becomes an “s.” What happens? Take, for example, company downsizing. If we change the term company layoffs to company hires, the link from hires to confidence will have to change to an “s” (as hires goes up, confidence goes ROI R Employee up — a change RS in the same direction). But this does not make the loop a balancing one, because the sign on the link to the next variable in the loop will change and the polarity of the loop is preserved. The link from company ROl to hires will now become an “s,” and the loop is still reinforcing. In general, whenever you change the name of a variable, you should recheck the sign of all links in and out of that variable.
TIP: To determine if o loop is reinforcing or balancing, one quick method is to count the number of “o’s’. If there are an even number of o’s (or zero), the loop is reinforcing; on odd number, it is balancing. Although this is on efficient method, you should always read through the loop to double-check that links are labeled Properly•
Using Reinforcing Loops
Whenever your company is experiencing exponential growth or decline, you can bet there is at least one reinforcing process at work. Reinforcing loops tend to destabilize systems because of their snowballing effect-small changes become large changes, fast. It is helpful, therefore, to try to identify these processes in order to gain insight into what may be generating growth or decline in your organization.
For additional guidance in drawing causal loop diagrams, see “Guidelines for Drawing Causal Loop Diagrams,” V3N1, February 1992.