Everything is connected. A child randomly kicks the elephant on the mobile hanging over her crib, and the other members of the aerial zoo shift their positions as well. An acorn drops in a quiet pond, and ripples move out over the whole surface. A butterfly flaps its wings in Brazil, and a tornado sweeps down the plains in Oklahoma.
These and other metaphors are often used to help explain systems theory, and they do so effectively — to a point. Many people can intellectually grasp the idea of interconnections in our world and the importance of taking a holistic perspective. But for some, the concept seems so easy to understand that they miss its value. For them, having a metaphorical understanding of systems thinking does not necessarily lead to action or to an integration of the concepts into everyday practice.
Nevertheless, it’s not necessary to have a deep understanding of systems theory in order to use it to influence institutional behavior. What is crucial is to connect some of the elements of systems thinking directly to proposed actions. In this article, I suggest how organizations might apply four models to make the transition from thinking to action. The iceberg metaphor helps to probe the underlying causes of events and patterns. The force field analysis provides a visual means of understanding the factors that keep organizations in “quasi-equilibrium” and the issues involved in any change process. The spidergram emphasizes linkages within a given system. Finally, behavior over time graphs draw attention to the long-range effects of organizational efforts.
The Iceberg (It’s bigger than you think!)
The iceberg is one of the most frequently used models to explain systems thinking (see “The Iceberg”). Thanks to movies like “Titanic,” many people recognize that most of an iceberg sits hidden beneath the water; that is, out of sight.
Different authors present the iceberg model as having from three to six levels; we’ll use a four-level model here.
In the iceberg model, the piece of the structure that appears above the surface represents a single “event.” A young woman arrives an hour late for work after dropping off her young child at a nursery. Her supervisor is understanding — this time. Just below the surface, a deeper level of examination reveals patterns of events, or “trends.” The young mother is late on the same day a week later. We might ask, in this case or any similar situation, whether these two events are unique or if a pattern of behavior is beginning to emerge.
It’s not necessary to have a deep understanding of systems theory in order to use it to influence institutional behavior.
Submerged below the level of the trend is the “structure,” the foundation that supports and creates the behaviors higher up in the pyramid. In the case of the working mother, is she late every week because the organization has strict policies about when staffers need to be in the office — policies that don’t take into account when daycare facilities open their doors in the morning? Would a more effective policy be one that allows employees to work flexible hours or dial in from home on some days? In organizations, the structure is often determined by its policies and procedures.
THE ICEBERG
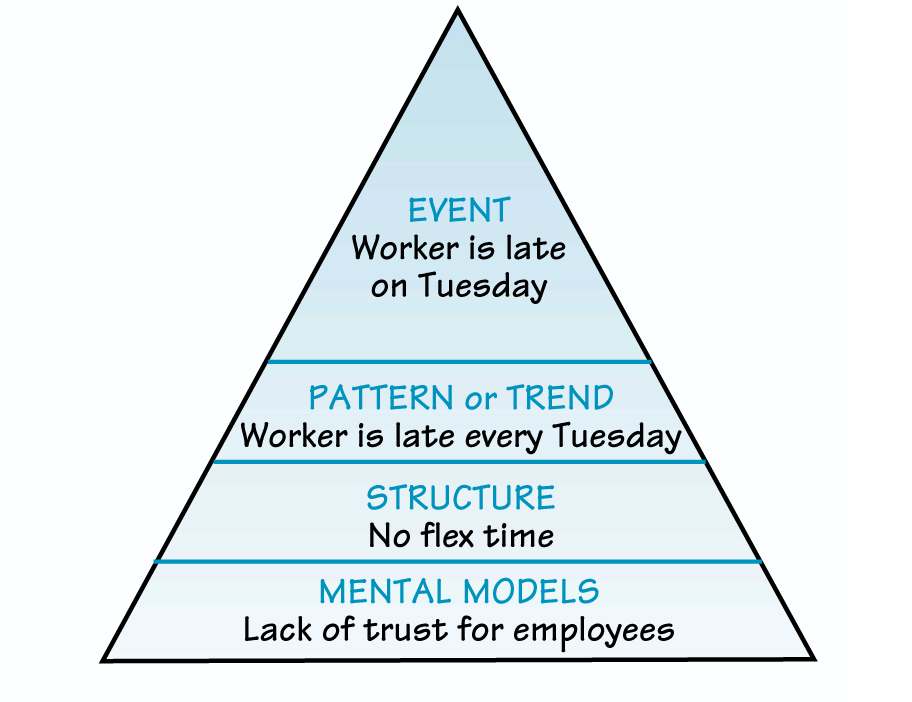
Each level down the iceberg offers a deeper understanding of the system being examined as well as increased leverage for changing it.
At the next level down, our “mental models” — and those of the people who came before us — affect the structures we put in place and the way we understand the top parts of the iceberg. Is the company founded on a sense of trust for its employees, or does management view itself as needing to monitor workers’ hours to make sure they put in what they’re being paid for? Is “face time” more important than productivity? These attitudes affect the company’s policies and ultimately how it treats all employees, including those with small children.
Each level down the iceberg offers a deeper understanding of the system being examined as well as increased leverage for changing it. Consider, for example, the response of many communities across the U. S. to the events of September 11. Immediately following the tragedy, various groups sponsored events embracing immigrants, with participants singing “We Are the World” and taking part in other heart-warming efforts to reach out to others in a time of national pain and anguish. These events were nice, but of little long-term significance. If the planners had applied the iceberg model to the process, they might have begun by asking simply, “Will we do this again? Should it become an annual event?”
Other questions lead deeper into the model. How do we keep this issue in people’s vision throughout the year? Are there other ways that we might integrate new immigrants into our community? How might we link “native” families to those who are new? And, ultimately, what can we do to open the minds of Americans to see the benefits of the diversity provided by the influx of immigrants? Such exploration might lead to a revival of workshops in cross-cultural understanding such as those brought forth by local ecumenical councils during desegregation.
As shown here, groups can use the iceberg model to improve program planning and to integrate systems thinking into the process. Next time you are involved in event planning, ask yourself whether you are planning an event or a whole movement!
FORCE FIELD ANALYSIS
Force Field Analysis (I’m losing my balance!)
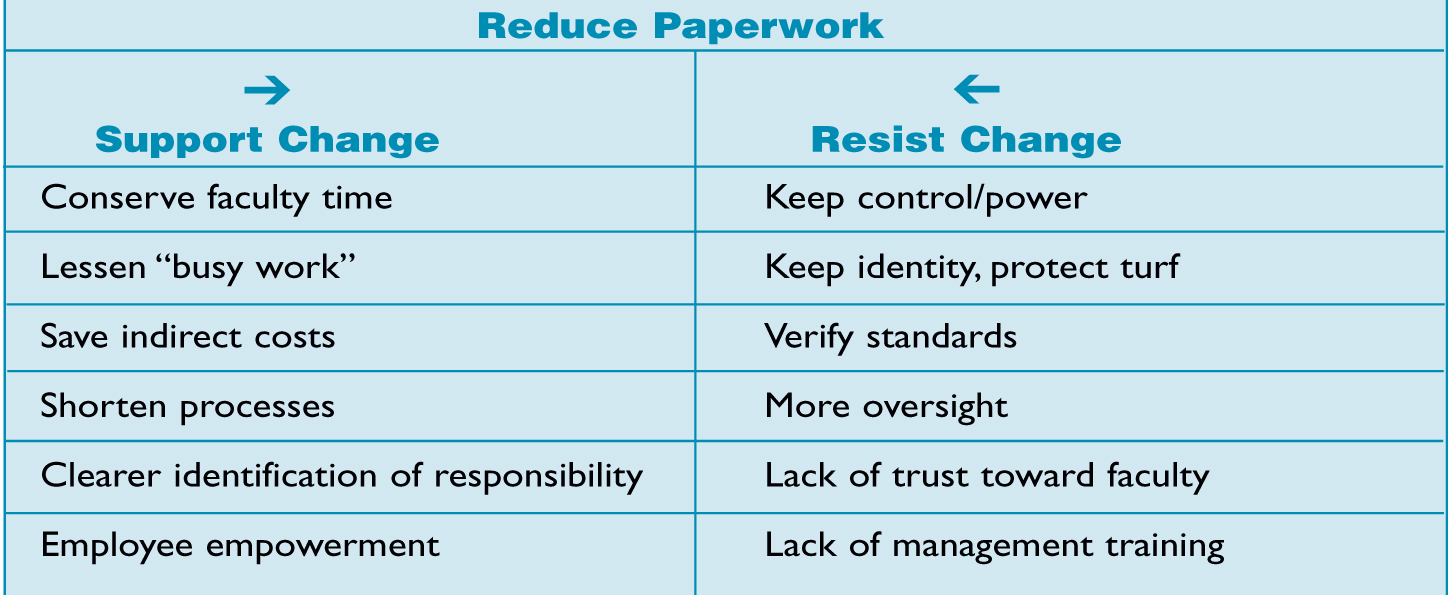
Another useful approach to getting deeper into a systems mode of thinking is the force field analysis attributed to Kurt Lewin (, “Resolving Social Conflicts,” Selected Papers on Group Dynamics, 1948). Force field analysis (FFA) is a well-known tool for examining change (see “Force Field Analysis”). It asks, “What forces are at play to increase the odds of a given change taking hold, and what are the elements hindering that change?” This framework provides a rich systems perspective on an issue.
The concept is simple. At any given moment, an organization is in equilibrium; that is, there’s a balance between opposing forces. Without this balance, operations couldn’t move along at their normal pace. When a new idea to change the way the organization operates comes along, it threatens to disrupt the balance. But the forces that maintain the status quo usually make it difficult for change initiatives to take root. The FFA offers a useful way to illustrate this dynamic.
As an example, consider the issue of organizational paperwork. When the academic vice president in an institution of higher education proclaims, “We must simplify operations and eliminate as much unnecessary paperwork as possible,” you can hear the roar of approval from the faculty. But then the change does not happen.
Why? The FFA analysis can provide an understanding of the system as it exists and why there is resistance to change.
Imagine the forces that oppose such a change. For instance, in an attempt to ensure that departments spend certain funds properly, the institutional effectiveness office creates a form requiring that someone from its staff sign off on expenditures of more than $100 from those funds. The graduate college believes that another college in the university is not following standards, so they insist on receiving duplicates of all paperwork that involves graduate students. Department chairs, who have not received any training regarding institutional procedures, fail to follow some of the mandatory processes and lose the trust of the vice president, who then insists on signing off on all travel forms. And on it goes.
In these situations, the top manager often tries to force the change with further declarations and threats. Predictably, the use of strong-arm tactics frequently results in greater resistance.
A more productive way to approach the problem is by listing and examining the balancing forces that prevent the change from taking root (see the table below). Is an individual’s status within the university determined by how many decisions he or she must sign off on? If so, how can we change this reality? Are new faculty members adequately trained on proper completion of paperwork? If not, why? In what ways do various policies reinforce the status quo? How did those forces come about? What can be done to eliminate the forces of resistance or to redirect them in such a manner that they support the proposed change? Each question expands our understanding of the system and opens up possible methods of supporting the initiative.
Spidergram (Not Spider Man!)
Another metaphor for explaining systems thinking is that of a spider web. In The Web of Life (Anchor Books, 1996), Fritjof Capra uses the spider web as the central metaphor to describe the interconnections of all life on Earth. A disruption at one point in the web has an impact that reaches to all points, as it also does in human institutions.
SPIDERGRAM
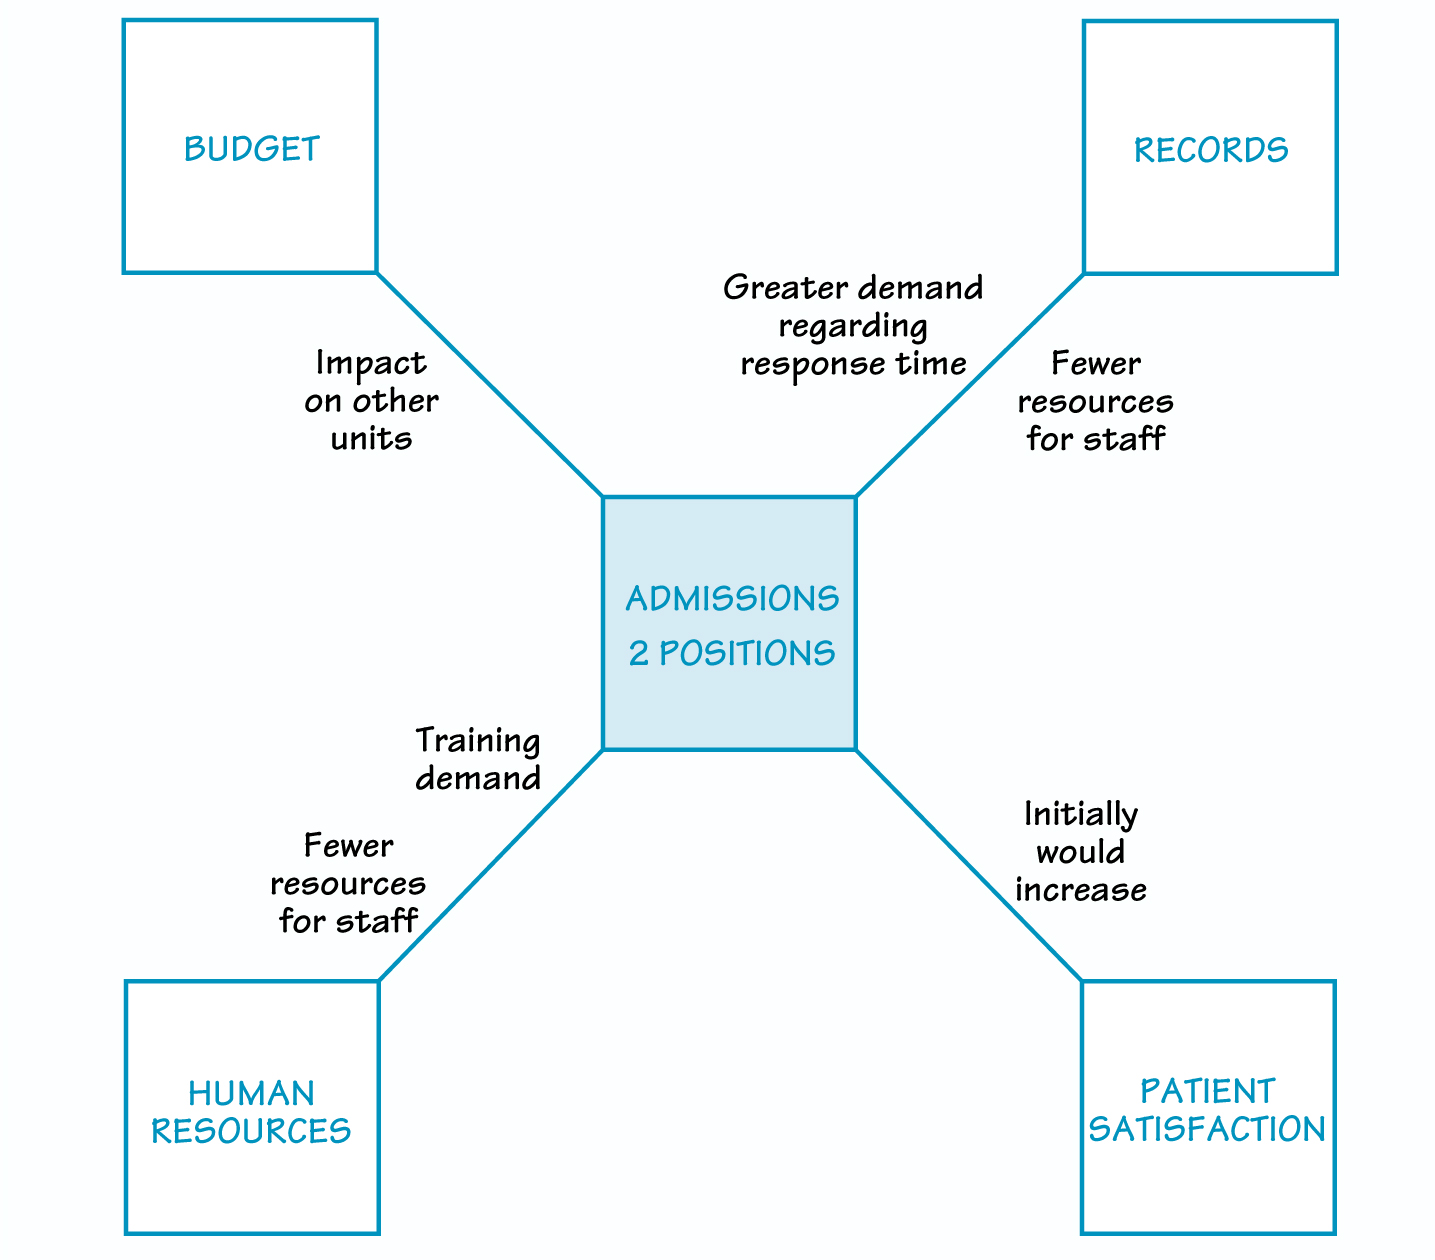
Applying this systems metaphor to organizational issues is easy through the spidergram (see “Spidergram”). First, place the initiative, change, or process to be modified in the center of the web. Then draw threads outward, with blocks at the ends that represent anchoring points for the web. Identify, at each anchor, a unit or process within the organization that might be affected by the change. Stretch your mind to identify all possible anchors. Then, along each line connecting the center to an anchor, indicate the potential impact that the action might have on the anchor.
Consider, for example, an admissions unit in a hospital. The CEO believes that no one should have to stand in line for anything. The admissions staff is aware of and agrees with this perspective. They would also like to reduce their workload, so when budget time comes around, they ask for two additional positions to be created. From their perspective, this is the right thing to do.
Applying the spidergram to this issue involves placing the admissions unit’s request in the center of the web. What then are the anchor points? They might include the hospital budget; the other departments that would be affected by adding expense and capacity to the admissions unit, such as the records office and human resources; and customer satisfaction.
The next step is to note anticipated side effects of funding two more positions in admission on the anchor points. Will other departments requesting positions go without? Will the workload in the records office increase to the point where it begins to cause delays in patient services? Are there other means of resolving the issue, such as sending patients paperwork in advance to complete before coming to the hospital?
The spidergram will not provide an answer as to whether or not the hospital should support the admissions office’s request. It will, however, help identify the interconnections that exist and the potential impact of the proposal beyond the single unit or process involved. It is an extremely useful systems thinking strategy to help an organization see the “big picture” and to avoid sub-optimizing the whole in order to fulfill requests by units with strong and persistent advocates.
Behavior over Time Graphs (The long view)
Short-term thinking leads to event-level actions (as shown in the iceberg model). The number of surgeries in a given month, students enrolled in the fall semester, and quarterly profits are all examples of short-term thinking. If people do view those bits of data historically, they often do so only in relationship to the previous year’s numbers, and begin and end the examination with the question “Are we up?” And often, closely examining the numbers is a guise for searching for someone to blame for a decline!
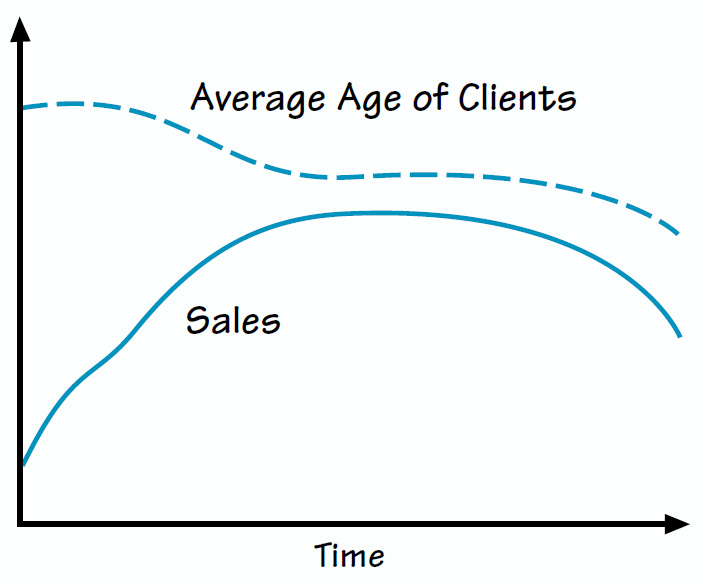
A systems perspective encourages looking at more data points over a longer period and within a larger context than we’re used to doing. It involves analyzing relevant trends and other patterns that may be acting on the numbers we’re examining at the moment. The graphs may include both historical data and anticipated or desired future trends after a particular intervention. These graphs do not have to be precise, though they should be representative of actual or projected trends in order to be of value. If taken seriously, so-called behavior over time graphs can provide a means for understanding the flow of events and enhance discussion both of the past and the future (see “Behavior over Time Graph” on p. 9).
Take the example of a decline in enrollment numbers in a given department within a large university. The president sees the drop and, with great frustration, calls the provost: “What’s going on over there? Why aren’t the faculty doing their jobs?” The provost calls the dean, who phones the department chair. The chair reminds the dean that they agreed to raise standards for admission to the program in order to meet increasing state employment standards for graduates. Looking at long-term student enrollment patterns in similar situations might have led the administrators to understand that numbers frequently decline at first before enrollment begins to rise again. And doing so might have kept everyone’s blood pressure in check.
“Behavior over Time Graph” represents a small local business that had a tremendous launch, but then experienced lagging sales. When top managers considered the demographics of the individuals they catered to, they recognized that many of the older retirees who had created their initial success had left the state or died. To boost sales, they would need to consider marketing to a slightly younger crowd or even altering their product. Graphing trends in the rise or fall of multiple variables (enrollment and the local economy in higher education, sales and new product introductions in manufacturing, and so on) helps generate discussion, leading to hypotheses and deeper understanding of the trends as part of creating an overall strategy.
BEHAVIOR OVER TIME GRAPH
Back to Start
Busy executives who think that systems thinking is interesting but of limited value are missing an important tool for change. The best-laid plans can go astray if the whole system has not been considered. Administrators in every kind of organization can benefit from the use of these and other metaphors and models that build a deep understanding of the systems within which they work and live, and strengthen their actions toward continuous improvement.
Ed Cunliff is assistant vice president for academic affairs at the University of Central Oklahoma, with major responsibilities in institutional research, assessment, continuous improvement, and the Academic Support Center. He is active in the pursuit of quality concepts on and off campus, and serves on the board of the National Consortium for Continuous Improvement in Higher Education. Ed’s interest in systems theory has led him to become involved with environmental issues, and he serves on several related boards.