Imagine you are the human resources director for a company in a rapidly growing industry. Your latest strategy meeting focused on developing a human resource policy to keep up with the expanding needs of the business. At this session, you developed a simple causal loop diagram that reflects your current staffing strategy: whenever there is a gap between current staff and desired staff, the company has traditionally hired or laid off workers until the gap decreased (BI in “Staffing Policy”).
Now you are wondering what the behavioral consequences of this strategy might be. Although the loop provides a general description of the staffing process, it gives no indication of how this strategy actually plays out over time. You know there are significant time delays involved in the process: the time it takes to recognize the gap, act on it, and hire or lay off staff. You wonder if there will be a smooth transition to the desired level, or if there will be large jumps in staffing numbers.
Here is where the computer model comes in. In the world of archetypes and causal loop diagrams, all of the elements of a system are defined without quantifying any numerical values, so you can only speculate about what behavior the system will produce. On a computer, however, you must quantify your assumptions about how elements are interrelated, which prompts deeper inquiry. Computer models also provide a way to test your hypotheses before acting on them.
But how do you get from archetypes and causal loop diagrams to computer models? The following steps provide a process for converting a causal loop diagram into a structural diagram as preparation for creating a computer model.
1. Identify the Behavior of the System
One of the questions beginning modelers often ask is, “How will I know if my computer model accurately represents the loops I’ve identified and the story I’m trying to tell?” Sketching the behavior of the system up front can help answer that question because it provides a reference point for gauging how well the model matches the expected behavior of the system. Past trends can be very useful at this stage.
In the employee staffing example, if the actual number of employees is less than the desired level, we will begin to hire employees to increase the numbers to be more in line with the desired level. Chances are, the number of employees won’t increase steadily until it reaches the target number. Instead, we will probably overshoot and oscillate around the target as our employee numbers fluctuate over time (see “Staffing over Time”). This diagram of the behavior we expect in the system should at least qualitatively match the output we get from our computer model later on.
2. Identify the Accumulators
When converting a causal loop diagram into a structural diagram, we begin by identifying the major elements — the accumulators and flows. In general, each loop in a causal loop diagram contains at least one accumulator — a stock of something that accumulates over time, like inventory, people, money, etc.
Staffing Policy
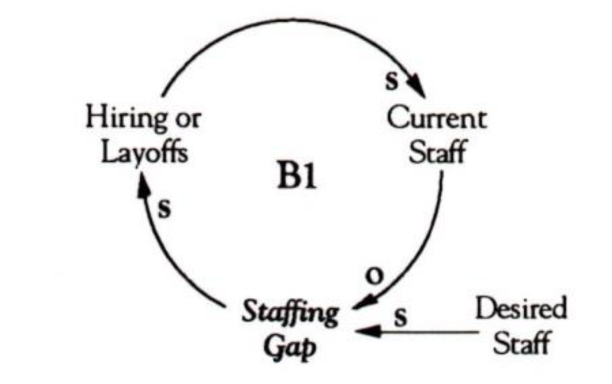
Employee staffing can be described by a simple balancing loop that says if there is a gap between current staff and desired staff, actions are taken (hiring or layoffs) to bring the anent level in line with the desired (B1).
A key characteristic of accumulators is that they are not a function of time. Therefore, a good way to identify the accumulators in a diagram is to use the “Freeze Test”: if we froze the system, what would be the things we could count? In the staffing example, we would be able to count the number of employees in the building, the current staff. In our structural diagram, we would represent this by creating an accumulator called “Current Staff.”
3. Identify Flows
Next, we want to identify the flows. Flows are like taps on a faucet, controlling the stream of contents into or out of the accumulator. To find the flows in our diagram, we would ask how the accumulation of staff changes. What causes the current staff number to go up or down? The number of people being hired or laid off. We can represent that relationship by drawing the flow between “Hiring or Layoffs” and “Current Staff” (see “Drawing a Structural Diagram”). Another good rule of thumb for identifying flows is to look for those things that are dependent on time.
4. Identify Other Relationships
Staffing over Time
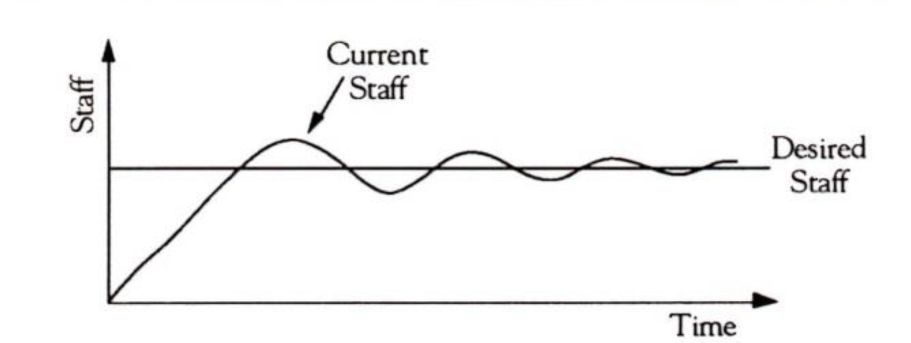
Time Drawing the behavior of the system up front provides a reference point to gauge how well the model matches the behavior you expect from the system.
To complete our diagram, we need to characterize the other significant relationships in the system. If we know that hiring and layoffs affect current staff, our next question might be, “What drives hiring and layoffs?” The answer would be the staffing gap. “Staffing Gap” is not an accumulator, because it cannot be physically counted if we freeze the system, nor is it a flow, because it is not dependent on time. The best way to describe the “Staffing Gap” is that it is simply a mathematical relationship between current and desired staff (“Current Staff’ minus “Desired Staff’ equals “Staffing Gap”). Such mathematical relationships are called “auxiliaries” because they help define the relationship between different parts of the diagram. We can show both “Staffing Gap” and “Desired Staff’ as auxiliaries by drawing circles with arrows linking them. We also want to show that our “Staffing Gap” is dependent on the current staff, so we draw an arrow from “Current Staff” to “Staffing Gap.”
Drawing a Structural Diagram
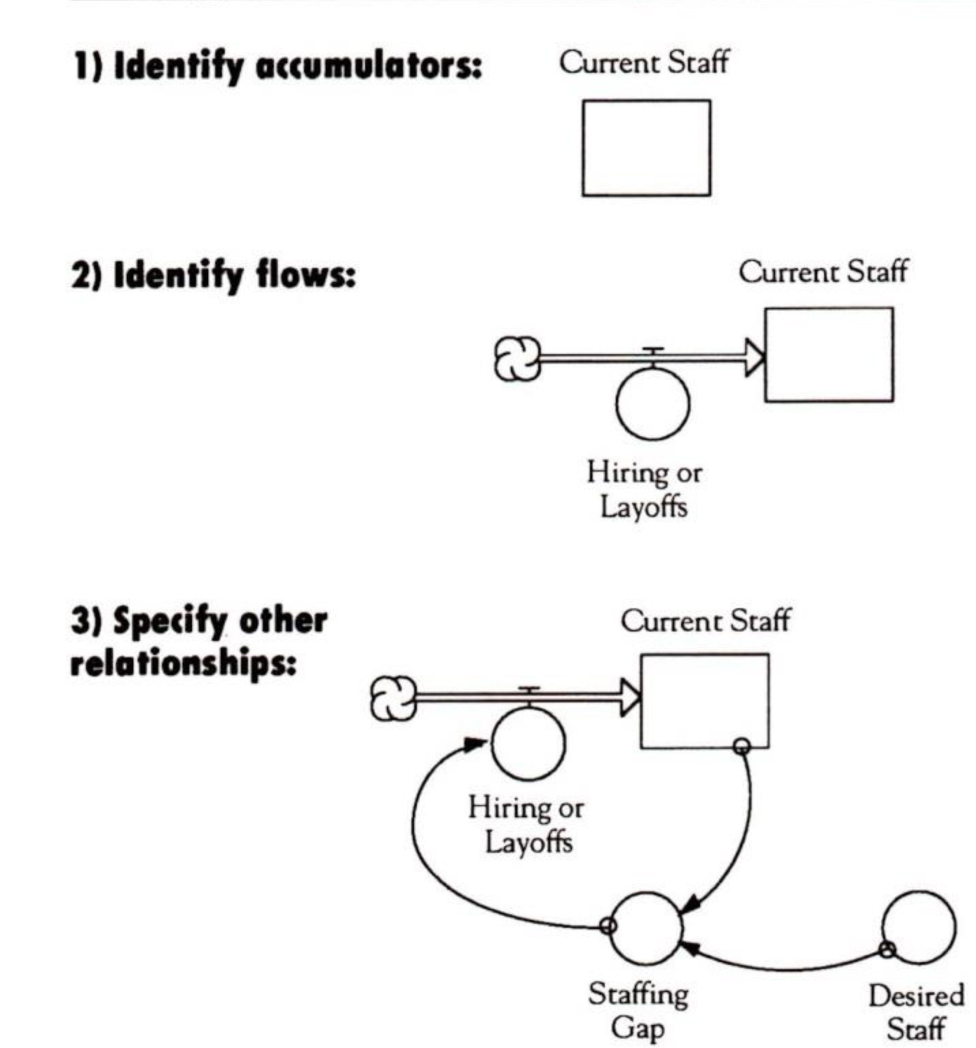
Causal loop diagrams and archetypes usually do not contain enough specificity about the relationships between the variables to create a computer model. By drawing a structural diagram of the system, we can identify the different types of variables in the system and how they affect each other.
S. Double Check that the Diagram Matches the Story
Once we have completed the structural diagram, we want to double check to make sure that it retains the same story as the causal loop diagram or archetype. If we walk through our diagram, we can see that it looks similar to the balancing loop, except that we have identified the different types of variables (i.e. accumulators and flows) in the system.
We may find that our structural diagram has more elements than our causal loop diagram. That is to be expected, because as we get more specific about the way the variables interact, we may need to add additional elements to further define those relationships. For example, we could have added “Retirement” or ‘Turnover” to be more explicit about how other flows affect current staffing.
6. Establish the Boundary of the Model
Before we move from the structural diagram into building the model, it is important to establish the boundary of the system we will be modeling. Otherwise, the temptation will continually be to expand the model, as we discover more and more factors that affect the system.
The term “Desired Staff,” for example, could be considered a dynamic rather than static variable. If we were to expand our model to include factors that determine the desired staff, we might add additional links to the company’s financial health, expansion plans, etc. However, we are focusing our model just on the factors that directly influence current staffing in order to understand how changes in desired staff impact our current staff. Within the boundaries of the problem we are studying, therefore, we can treat “Desired Staff’ as fixed. Later, when we simulate, we can explore how varying the “Desired Staff” affects the overall behavior.
Now that we have created structural diagrams from our causal loops, the next step is to bring the structure to life. For a discussion of the steps in this process, see next issue’s “Toolbox.”
The example and diagrams used in this article were taken from “Moving Into Computer Modeling” by Michael Goodman, which appears in the upcoming Fifth Discipline Fieldbook (Doubleday: forthcoming July 1994) .
Michael Goodman is vice president of Innovation Associates (Framingham, MA) and a frequent contributor to The Systems Thinker. He has been involved in the field as an educator and consultant for over 20 years.
Editorial support for this article was provided by Colleen Lannon-Kim.