You have probably already learned about the importance of distinguishing among events, patterns, and structure. But still, you may be finding it difficult to apply this distinction. Perhaps when you try to analyze an issue from this perspective, the lines between patterns and structure get blurred or you find structure hard to see. You are not alone many learners encounter these difficulties. There are guidelines, however, that can help you to see structure and seeing structure will provide you with leverage for solving your long-term business challenges.
What Is Structure?
Let’s say that, on your way home from work, you run into a traffic jam. You know that you can gain leverage and find potential lasting solutions by surfacing the underlying structure. So you ask yourself, “O.K., what’s causing this traffic tie-up?” Your first answer will probably focus on the forces responsible for the heavy traffic, such as “decaying road surfaces” and “frequent accidents.” But, aren’t these patterns and trends you could plot on behavior over time graphs? At this point, you may frown and ask, “So what exactly is structure? What distinctions are we making?”
By its very nature, structure is difficult to see.
Structure is the network of relationships that creates behavior. The essence of structure is not in the things themselves but in the relationships of things. By its very nature, structure is difficult to see. As opposed to events and patterns, which are usually more observable, much of what we think of as structure is often hidden. We can witness traffic accidents, for example, but it’s harder to observe the underlying structure that causes them.
We also need to distinguish between internal structures, or causal relationships that involve mental models, and external structures, or causal relationships based on systemic structures, such as information and communications systems. (For more details on the distinction between mental models and systemic structures, see “From Event Thinking to Systems Thinking,” May 1996.)Internal structures are usually the most important structural elements in a system, because they are like the software that drives the hardware of organizational structures.
SEEING THE DEEPER STRUCTURE
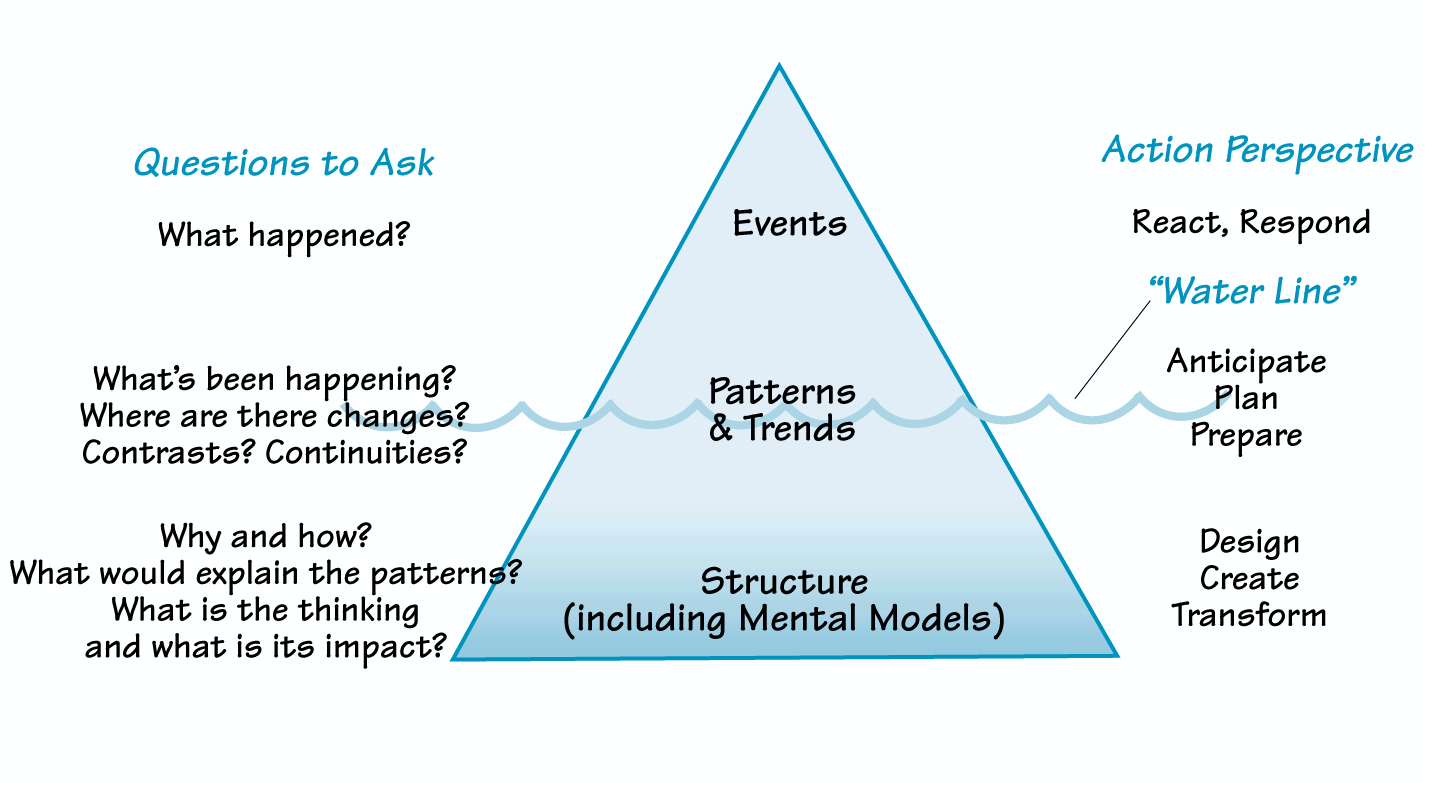
Like the submerged portion of an iceberg, underlying structure may be difficult to see. The “water line” divide what’s easy to see(events) form what’s harder to see(the underlying structure that causes events). We can see some patterns, but others aren’t as obvious.
Seeing Structure
The often referenced iceberg diagram is useful for moving from the events and patterns levels to the structural level (see “Seeing the Deeper Structure”). But instead of thinking of the iceberg in terms of different kinds of things that exist in the world, think of it as showing different ways of seeing the world. That is, focus on seeing structures, causal connections, and relationships to start to explain what’s happening.
If we see the world in terms of events, then the best we can do to be effective is to react to an occurrence by asking, “What happened?” If we can see beyond individual events to patterns and trends, then we can anticipate, plan, forecast, and adapt. To see patterns, we ask, “What’s been happening? Where are there differences, contrasts, or continuities overtime?” But if we are able to move to the third level of viewing the world, we will be able to find structural explanations. By asking, “What would explain these patterns?” we can begin to see causal connections and make hypotheses about the underlying factors that created the observable events and patterns.
Because structure is about the relationships among parts of a system, a structural observation must include a causal connection, not just a list of the forces or elements of the system. So, to make structural observations, we need to go beyond listing factors (for example, “compensation systems”) to articulating causal relationships (for example, “the compensation system is causing people to focus on short-term goals”).
And because structure isn’t always directly observable, we often must make hypotheses about how it operates and then test our theories. If you’re having trouble seeing structural relationships and making hypotheses, go back to the patterns level and look at data. Look for differences and changes over time. The answer to the question “What would explain these patterns?” often stimulates structural observations.
Seeing at Multiple Levels
Let’s return to our problem with traffic to see how we can view a situation at multiple levels.
Seeing at the Events Level: There is an accident on the highway; traffic is backed up; and emergency vehicles are on the scene. A driver caught in this mess thinks, “Damn! I’m gonna be late for dinner again! I never should have come this way!”
Seeing at the Patterns and Trends Level: There are always accidents on this highway. Also, there are daily and weekly patterns of traffic, rush hours, and slack times. Drivers during rush hour are more stressed and have more on their minds than drivers at other times of day. They are most concerned with getting someplace quickly and avoiding traffic tickets; they don’t notice their own driving practices.
A BAD STRETCH OF HIGHWAY
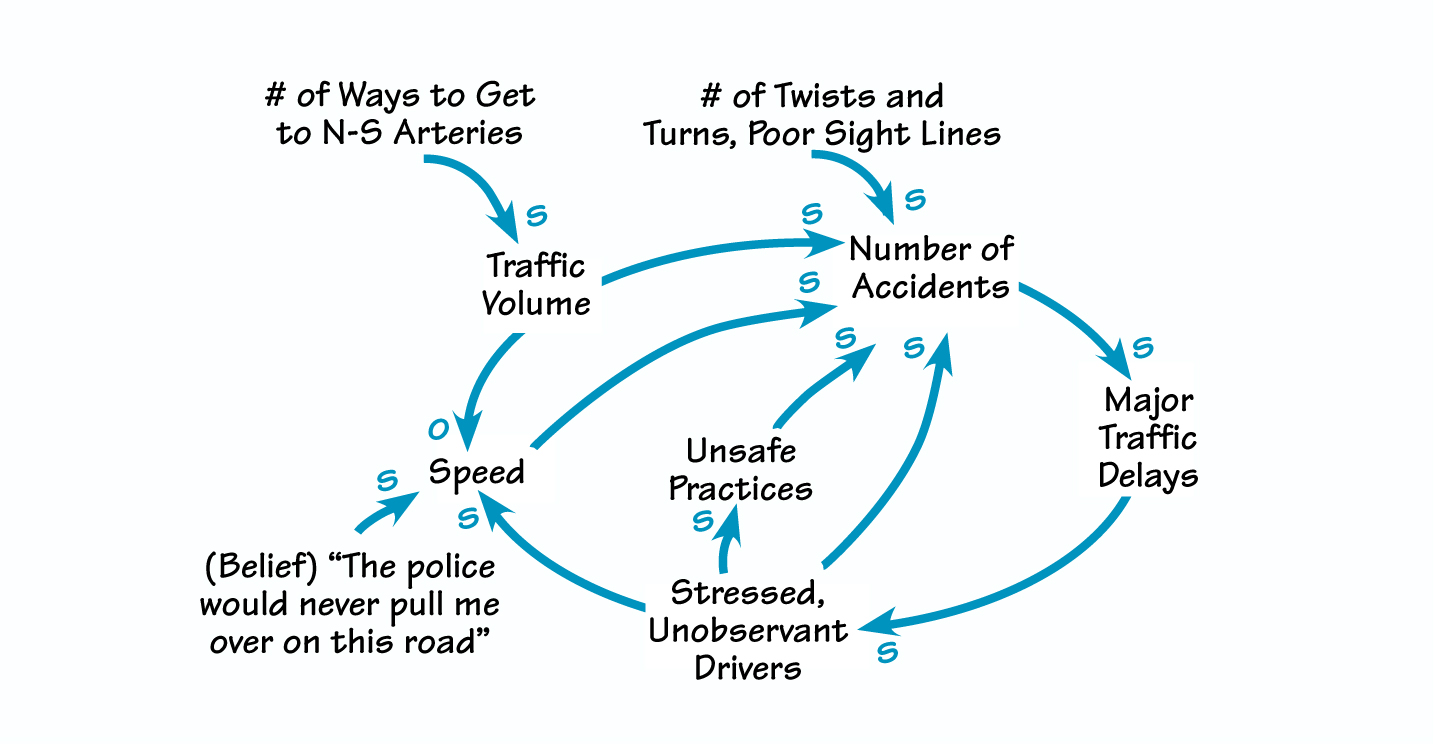
To keep track of complexity and see how structural elements operate together. Place your structural observations in a diagram and add arrows to indicate causal relationships. This method usually leads you to discover even more connections.
Seeing at the Structural Level:
A structural observation must include a causal connection.
1) This highway is old, narrow, and has poor sight lines, causing more accidents when traffic is heavy.
2) Most drivers heading north and south out of the city have to use this road, making the traffic even heavier.
3) Motorists are changing lanes because of the many ramps and exits.
4) Drivers think the state police won’t enforce speed limits because police cruisers would cause major traffic tie-ups. So, drivers tend to drive faster, causing more accidents.
5) Because motorists are in a hurry and don’t notice their own driving practices, they do unsafe things (such as cutting in, tailgating, and speeding).
To keep track of complexity and see how structural elements operate together to produce an overall result, you can place your structural observations in a diagram and add arrows to indicate the causal relationships (see “A Bad Stretch of Highway”). This method usually leads you to discover even more connections.
The world we deal with is very much like our iceberg diagram. There’s a lot hidden beneath the surface, and one of the aims of systems thinking is to help us discover it! The purpose of moving through the different levels of the iceberg is to stimulate seeing, thinking, and insight. Of course, we don’t just want to see and understand better, but to act and intervene differently for better results. However, seeing and understanding are the essential first steps for taking more effective action.
Richard Karashis an independent consultant in Boston, MA, specializing in systems thinking training, facilitation, and capacity development. He is an adjunct staff member of Innovation Associates, Inc., an Arthur D. Little Company.
Editorial support for this article was provided by Janice Molloy. For additional discussion about moving from insight to action, see “Going Deeper: Moving from Understanding to Action,” November 1995.