Archetypes in systems thinking are commonly occurring, generic structures of multiple feedback loops. These widely studied models provide immediate insight into the potential pathologies of a system and ideas for correcting them. For many managers, the rich story-telling quality of the archetypes untangles some of the dynamic complexity of systemic behavior. But once we have gained insight from an archetype, how can we use our new knowledge to avoid getting caught up in the counter productive dynamics that the archetype depicts? For example, what organizational structures and conflicting departmental incentives might make usespecially vulnerable to different archetypes? We have found SVOM useful for identifying misaligned functional goals that may be under-mining the health of the larger system. This process provides a basis for designing companywide structures that eliminate sources of conflict among departments.
ARCHETYPE OF THE MARKET GROWTH MODEL
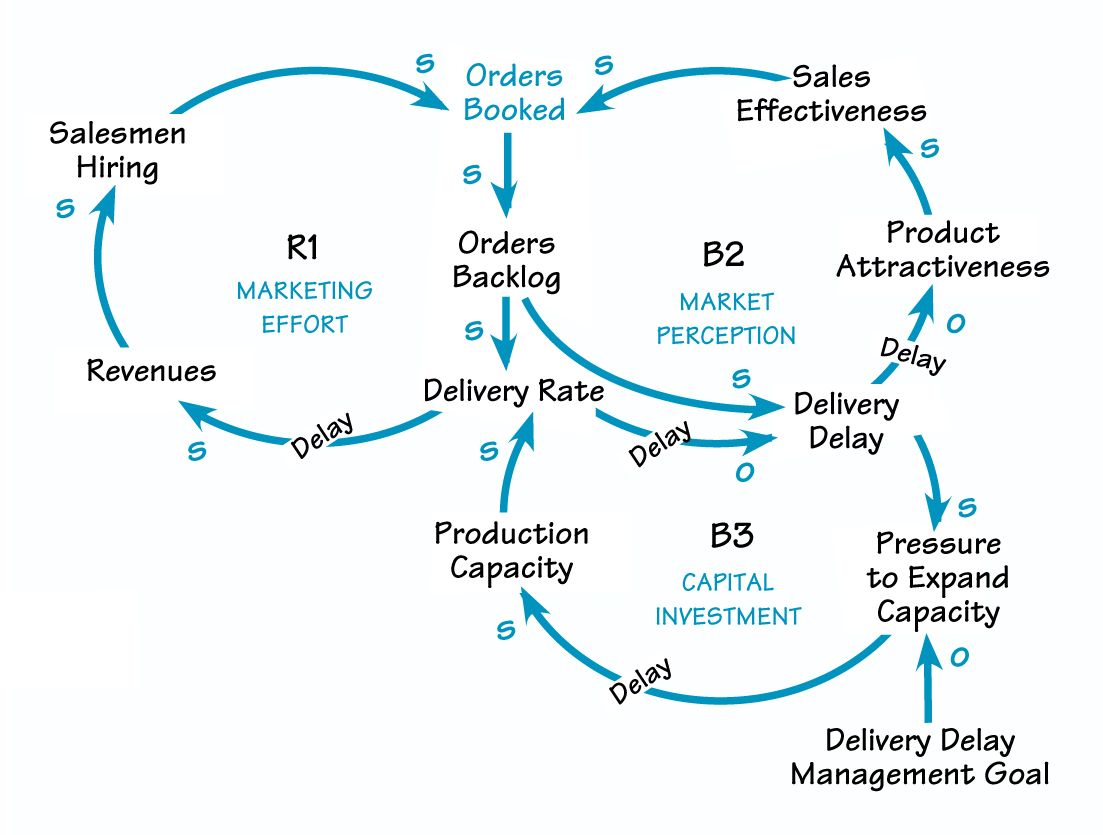
Delivery delays (B2) limit the growth generated by the efforts of the sales force (R1) because customers cannot be billed for products that haven’t been shipped. Instead of seeking to increase revenue by increasing sales, the company should invest in production capacity so as to meet customer delivery requirements (B3)
The SVOM analysis consists of two parts. The first part is an overlay of departmental boundaries on an existing causal loop or stock and flow diagram. The overlay simply draws the organizational boundaries implicit in the organizational chart, identifying the main functions involved in the dynamic depicted in the diagram and the areas of possible conflict over resources among each of these groups. For example, Marketing and Sales may have a strong influence on Customer Service performance by controlling customer satisfaction. The second part of the analysis assesses the relationships among the different functional areas in greater detail, exploring how each group perceives its interactions with others as well as the problems created by these different perceptions. We will discuss the second part, the SVOM Relationship Assessment, in the second article in this series.
To create a SVOM overlay for a causal loop or stock and flow diagram:
- Define and name the main groups participating in the system, such as Sales, Production, and Customers.
- For each variable in the model, identify which group directly controls it.
- Draw lines to divide the variables in the model among the groups that directly control them. This demarcation shows where the responsibility fora resource shifts from one group to another. These are “shared resources,” in that they are controlled by one group but also affect the performance of other groups in the system.
- Identify the formal and informal incentives for each group by asking, How do they identify success? What do they think they have to achieve to be good at their jobs?
- Express the rationale behind local perspectives by asking: How would this group explain the decisions and choices that they’re making? For example, Customer Service would like to build customer loyalty by assisting the client in the best way possible; however, they might not feel they have enough capacity to give quality service to every customer.
- Identify misaligned incentives among groups and how they affect the management of shared resources. How do conflicting incentives cause one group to do things, with the resources that they control, that are counter productive to the objectives of the other groups affected by those same resources?
The Market Growth Model
To illustrate how to apply the SVOM overlay, let’s use Jay Forrester’s well-known Market Growth Model as a case study. In the “Building Blocks” article in the October 1998 issue of THE SYSTEMS THINKER, Daniel Kim showed that the “Growth and Underinvestment” archetype best captures the spirit of the Market Growth Model. In this example, the firm’s growth is limited by its attempts to spur demand before adding capacity.
In “Archetype of the Market Growth Model,” delivery delays (B2)limit the growth generated by the efforts of the sales force (R1). According to this archetype, instead of seeking to increase revenue by increasing sales, the company should invest in production capacity so as to meet customer delivery requirements (B3). By expanding its capacity, the organization reduces delivery delays and, in turn, increases sales. This all may seem quite simple. However, it is not intuitive, as evidenced by the number of firms that fall into this systemic trap.
By following the steps listed above, we can identify the main groups interacting in the system, their shared resources, and local motivation(see “Systemic View of the Organizational Map Analysis”). Note that, in trying to understand how the overall system behaves, we usually depict archetypes with simplified causal loop diagrams because we are more concerned with telling the story than with the details. A more precise causal loop diagram helps us identify more clearly each group’s resources. The SVOM analysis shows that the stated objective of the Sales group is to maximize the number of orders booked. This makes sense-it’s their job and what they do well. The Production group is paid to maximize capacity utilization and thus delivery rate, within their capacity constraints.
SYSTEMIC VIEW OF THE ORGANIZATIONAL MAP ANALYSIS
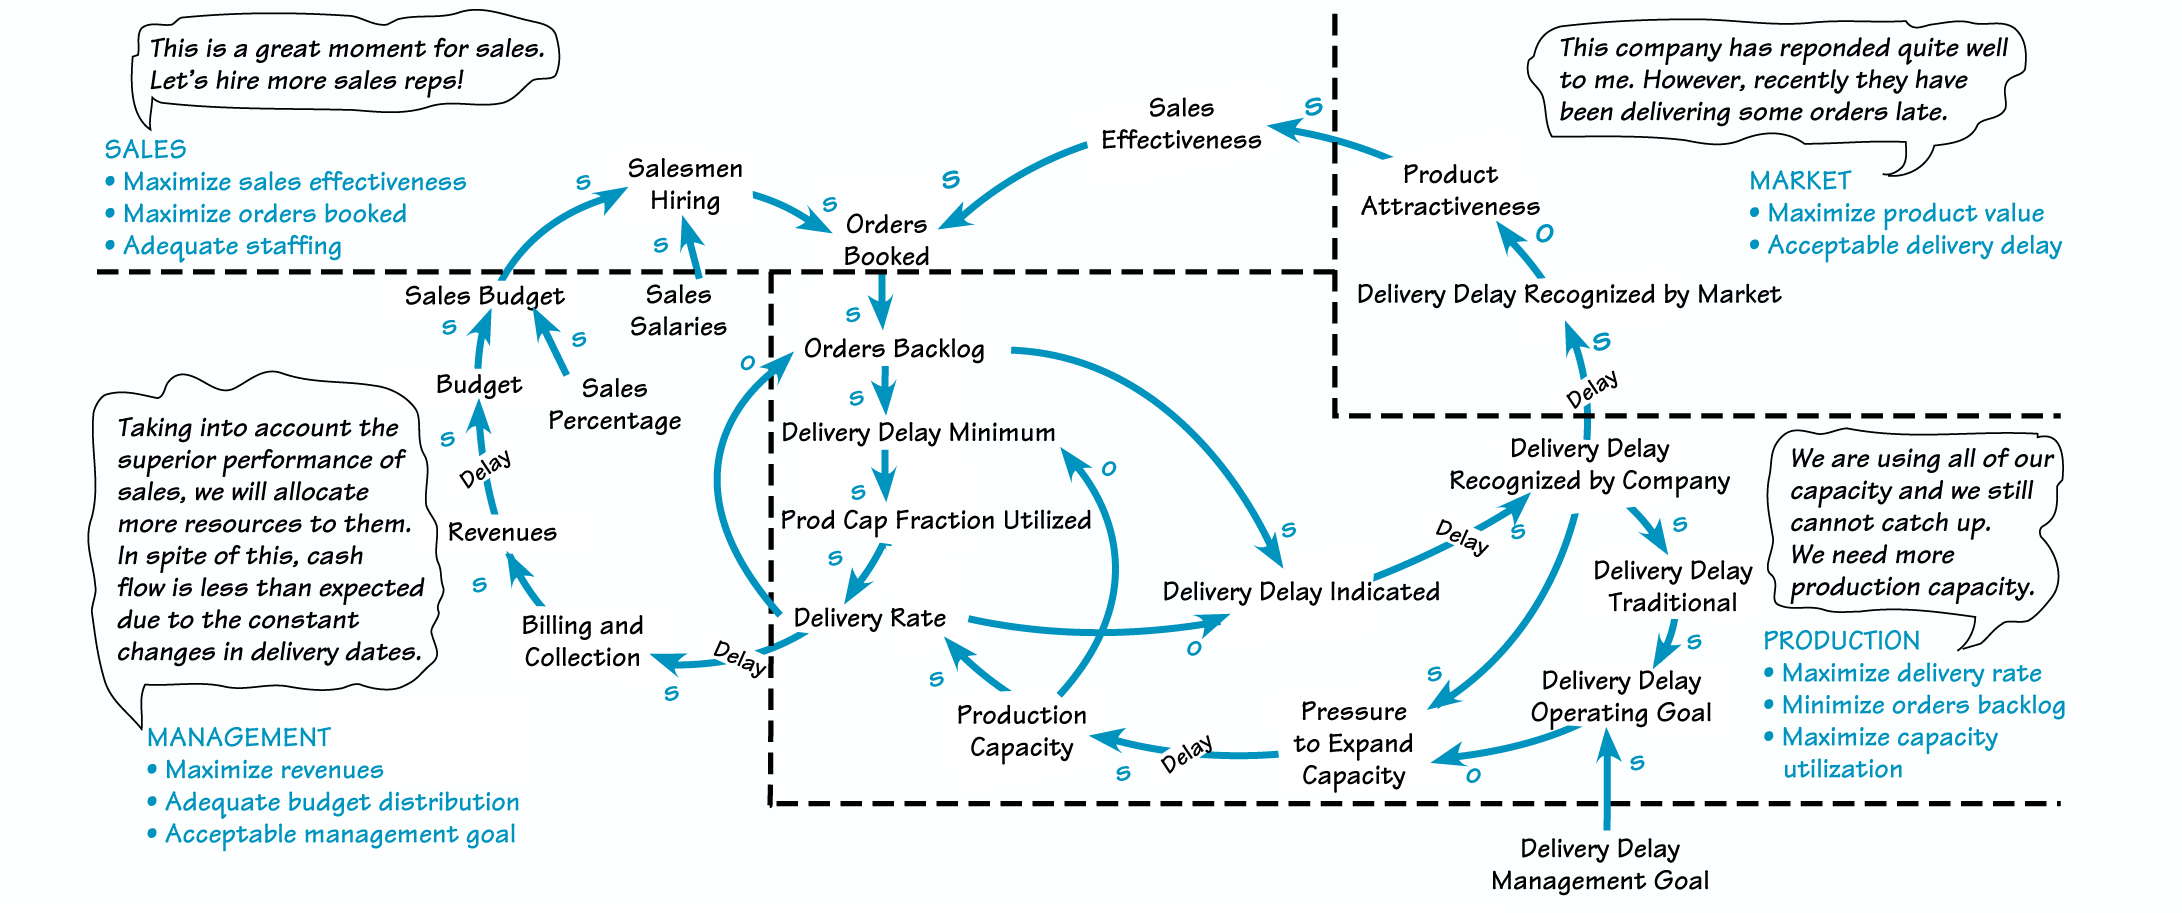
The SVOM analysis shows that the objective of the Sales group is to maximize the number of orders booked. The Production group is paid to maximize capacity utilization and thus delivery rate, within their capacity constraints. When we analyze the relationship between these departments, we find that these local rationales aren’t necessarily in alignment.
However, when we analyze the impact of these two local perspectives on the system as a whole, we see that long time delays mean that when sales activity increases and production capacity stays the same, the backlog of orders grows. This worsening backlog decreases the attractiveness of the product and ultimately hurts sales.
The main issue is that different groups control the strategic resources in the system. For example, the Sales group increases the backlog of orders by selling more and the Production group decreases the backlog of orders by producing more. But because Production needs to utilize their capacity in the most productive and efficient manner possible, they often avoid expanding that capacity for as long as possible. As a result, Order Backlog might increase to the point of eroding customer growth (a Sales group resource). In the next article, we’ll look more closely at what kinds of relationships exist among these groups, how the groups perceive their interactions with each other, and how to use the SVOM process to ensure the achievement of both local and companywide goals.
James Ritchie-Dunham is president of SDSG, LLC (The Strategic Decision Simulation Group), executive director of The Leverage Institute, and a consultant member of the Society for Organizational Learning. Annabel Membrillo is a consultant with SDSG, LLC.