Causal loop diagrams are an important tool for representing the feedback structure of systems. They are excellent for
- Quickly capturing your hypotheses about the causes of dynamics;
- Eliciting and capturing the mental models of individuals and teams;
- Communicating the important feedback processes you believe are responsible for a problem.
The conventions for drawing CLDs are simple but should be followed faithfully. Think of CLDs as musical scores: At first, you may find it difficult to construct and interpret these diagrams, but with practice, you will soon be sight-reading. In this article, I present some important guidelines that can help you make sure your CLDs are accurate and effective in capturing and communicating the feedback structure of complex systems.
Avoid Ambiguity in Labeling Causal Links
AMBIGUITY OF LINKS
To be effective, your CLD should not include any ambiguous causal links. Ambiguous polarities usually mean there are multiple causal pathways that you should show separately.
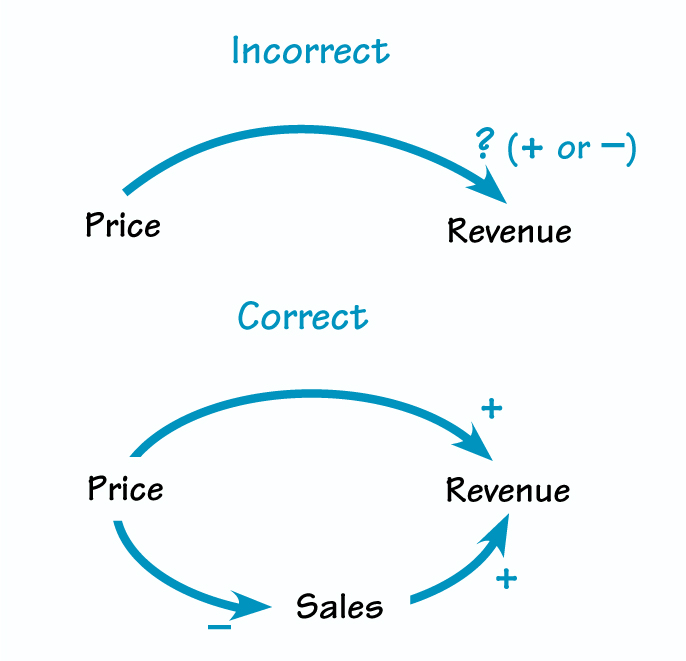
People sometimes argue that a specific link in a CLD can be either positive or negative, depending on other parameters or on where the system is operating. For example, we might draw a diagram that relates a firm’s revenue to the price of its product and then argue that the link between price and company revenue can be either positive or negative, depending on the elasticity of demand (see “Ambiguity of Links”). A higher price means less revenue if a 1 percent increase in price causes demand to fall more than 1 percent. This link would be labeled with a negative sign. But less elastic demand might mean a 1 percent increase in price causes demand to fall less than 1 percent, so revenues would then rise, resulting in a positive link polarity.
When you have trouble assigning a clear and unambiguous sign to a link, it usually means there is more than one causal pathway connecting the two variables. You should make these different pathways explicit in your diagram. The correct diagram for the impact of price on revenue would show that price has at least two effects on revenue: (1) it determines how much revenue is generated per unit sold (a positive link), and (2) it affects the number of units sold (usually a negative link).
'+' AND '–' VS. 'S' AND 'O'
Is It Reinforcing or Balancing?
There are two methods for determining whether a loop is reinforcing or balancing: the fast way and the right way. The fast way, which you may have learned when you first started working with CLDs, is to count the number of negative links—represented by “-” or “o”—in the loop (see “‘+’ and ‘-’ Vs. ‘s’ and ‘o’”). If the number is even, the loop is reinforcing; if the number is odd, the loop is balancing. However, this method can sometimes fail, because it is all too easy to mislabel a link’s polarity or miscount the number of negative links.
The right way is to trace the effect of a small change in one of the variables around the loop. Pick any variable in the loop. Now imagine that it has changed (increased or decreased), and trace the effect of this change around the loop. If the change feeds back to reinforce the original change, it is a reinforcing loop. If it opposes the original change, it is a balancing loop. This method works no matter how many variables are in a loop and no matter where you start.
Make the Goals of Balancing Loops Explicit
All balancing loops have goals, which are the system’s desired state. Balancing loops function by comparing the actual state to the goal, then initiating a corrective action in response to the discrepancy between the two. It is often helpful to make the goals of your balancing loops explicit, usually by adding a new variable, such as “desired product quality” (see Desired Product Quality in “Explicit Goals”). The diagram shows a balancing loop that affects the quality of a company’s product: The lower the quality, the more quality improvement programs the company initiates, which, if successful, correct the quality shortfall.
EXPLICIT GOALS
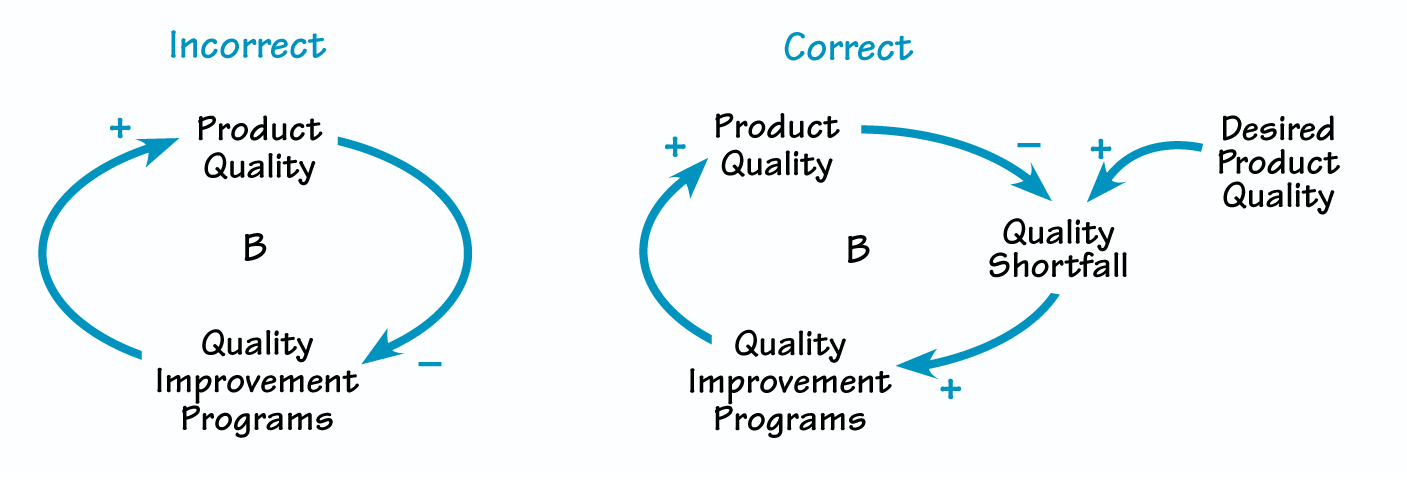
Making goals explicit in balancing loops encourages people to ask questions about how the goals are formed. For example, what drives a company’s desired level of quality?
Making goals explicit encourages people to ask how the goals are formed; for instance, who determines desired product quality and what criteria do they use to make that determination? Hypotheses about the answers to these questions can then be incorporated in the diagram. Goals can vary over time and respond to pressures in the environment, such as customer input or the quality of competing products.
Making the goals of balancing loops explicit is especially important when the loops capture human behavior—showing the goals prompts reflection and conversation about the aspirations and motives of the actors. But often it is important to represent goals explicitly even when the loop doesn’t involve people at all.
Represent Causation Rather Than Correlation
Every link in your diagram must represent what you and your colleagues believe to be causal relationships between the variables. In a causal relationship, one variable has a direct effect on another; for instance, a change in the birth rate alters the total population. You must be careful not to include correlations between variables in your diagrams. Correlations between variables reflect a system’s past behavior, not its underlying structure. If circumstances change, if previously dormant feedback loops become dominant, or if you experiment with new decisions and policies, previously reliable correlations among variables may break down.
ICE-CREAM SALES AND MURDERS
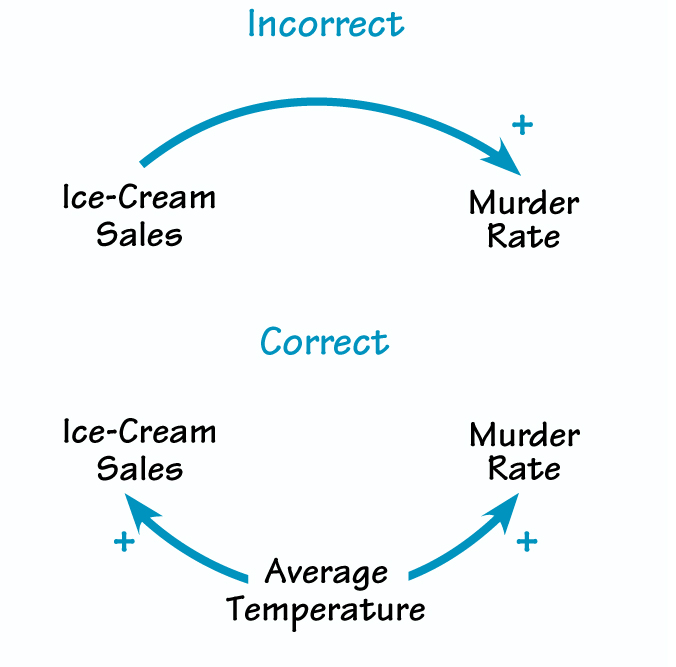
Causal loop diagrams must include only what you believe to be genuine causal relationships, never correlations, no matter how strong.
For example, though sales of ice cream are positively correlated with the murder rate, you may not include a link from ice-cream sales to murder in your CLD. Such a causal link suggests that cutting ice-cream consumption would slash the murder rate and allow society to cut the budget for police and prisons. Obviously, this is not the case: Both ice-cream consumption and violent crime tend to rise in hot weather. But the example illustrates how confusing correlations with causality can lead to terrible misjudgments and policy errors (see “Ice Cream Sales and Murders”).
While few people are likely to attribute murders to the occasional double-dip cone, many correlations are more subtle, and it is often difficult to determine the underlying causal structure. A great deal of scientific research seeks the causal needles in a huge haystack of correlations: Can eating oat bran reduce cholesterol, and if it does, will your risk of a heart attack drop? Does economic growth lead to lower birth rates, or is the lower rate attributable to literacy, education for women, and increasing costs of child-rearing?
Do companies with serious quality improvement programs earn superior returns for stockholders?
Scientists have learned from experience that reliable answers to such questions are hard to come by and require dedication to the scientific method—controlled experiments; randomized, double-blind trials; large samples; long-term followup studies; replication; statistical inference; and so on. In social and human systems, such experiments are difficult, rare, and often impossible. You must take extra care to determine that the relationships in your CLDs are causal, no matter how strong a correlation may be.
John D. Sterman is the J. Spencer Standish Professor of Management at the Sloan School of Management of the Massachusetts Institute of Technology and director of MIT’s System Dynamics Group.
This article is part of a 2-part series. Click here to view the second part.