Daily, we are exposed to information from a multitude of sources: the media, newspapers, radio, T. V., and the Internet. Generally this kind of information reports events – what happened, where, when, how, who was involved, etc. This level of information is very shallow as it represents a snapshot of reality that only touches the surface of what actually happened. For example, the stock market information that is reported daily gives a snapshot of the day’s activities. It tells us whether stocks, on average, went up or down (often the index goes both up and down within the same day) and by how much. We also get information on the volume of shares traded, the dollar value of stocks traded (capital turnover), and much more. All of this information is at event level.
Commentaries about a news item or an issue allow one to examine trends and patterns of events and data. This provides a richer picture of reality and gives more insight into a “story.” In the case of stock market, this means looking at the trends over the past several months or years, observing the fluctuations in the market, and trying to explain “pulses” in the system – for example, news of a merger, a quarterly economic report, or a political scandal.
However, it is not common to read reports of how such trends and patterns relate to and affect one another. This represents a much deeper level of thinking that can show how the interplay of different factors brings about the outcomes that we observe. In the case of stocks, this means relating a number of factors that systemically cause the market fluctuations. These factors could be economic, social, political, or structural. The critical thing at this level of thinking is to understand how these factors interact.
TEAM TIP
Whether your organization is more inclined to take a “hard” or “soft” approach to systems, use some of the processes outlined in this article to begin to shift from “event thinking” to looking at patterns, structures, and mental models.
There is yet another, deeper level of thinking that hardly ever comes to the surface. This is the “mental model” of individuals and organizations that influence why things work the way they do. Mental models reflect the beliefs, values, and assumptions that we personally hold, and they underlie our reasons for doing things the way we do. However, these generally remain “undiscussable,” according to noted educationalist Chris Argyris (Argyris, 1990).
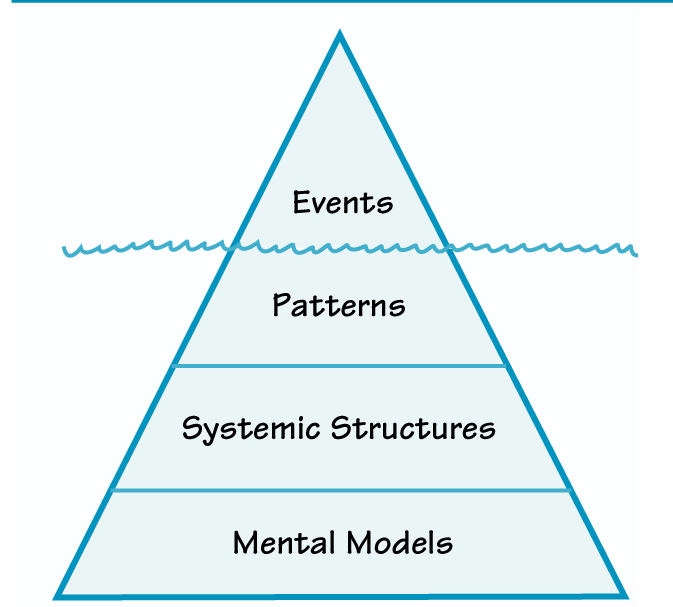
The four levels of thinking described above are shown in “Four Levels of Thinking.” This figure uses the analogy of an iceberg, where the event level of thinking is only the tip and yet most of us are satisfied with this level. This is because events are the most visible part and often require immediate attention.
FOUR LEVELS OF THINKING
Systems Thinking and Modeling Methodology
The systems thinking and modeling methodology (ST&M) outlined here refers to a set of conceptual and analytical methods. The general approach is based on the system dynamics methodology that was initially developed by Jay Forrester and others at the Massachusetts Institute of Technology in the late 1950s, based on developments following World War II in:
- the theory of information feedback systems
- the understanding of decision-making processes
- the use of mathematical models to simulate complex systems
- the development of high-speed computing as a means of simulating mathematical models
There are several definitions of the system dynamics methodology. Wolstenholme (1997) offers the following description for system dynamics and its scope:
Why: For the purpose of solving problems and creating more robust designs, which minimize the likelihood of unpleasant surprises and unintended consequences.
How: By creating operational maps and simulation models that externalize mental models and capture the interrelationships of physical and behavioral processes, organizational boundaries, policies, information feedback, and time delays; and by using these architectures to test the holistic outcomes of alternative plans and ideas.
Within: A framework that respects and fosters the needs and values of awareness, openness, responsibility, and equality of individuals and teams.
The Five-Phase ST&M Process The development of a systems thinking and modeling (ST&M) intervention involves five distinct but interrelated phases:
- problem structuring
- causal loop modeling
- dynamic modeling
- scenario planning and modeling
- implementation and organizational learning
These phases follow a process, each involving a number of steps, as outlined in “The Five-Phase Process of Systems Thinking and Modeling”. However, it must be emphasized that an ST&M intervention does not require all phases to be undertaken, nor does each phase require all the steps listed in the table. Rather, these phases and steps are presented as guidelines, and which phases and steps are included in a particular ST&M intervention depends on the issues or problems that have generated the systems inquiry and the degree of effort that the organization is prepared to commit to the intervention.
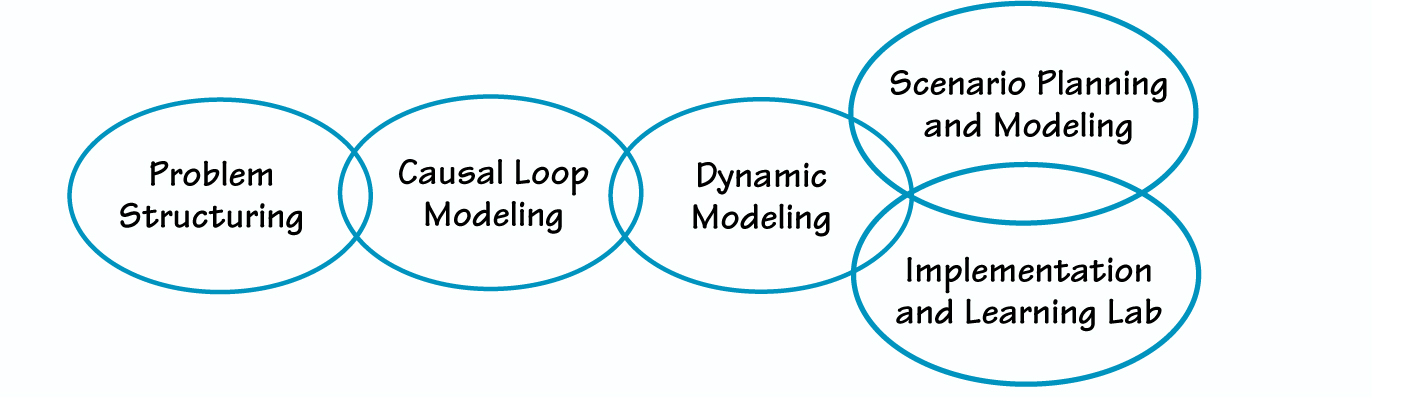
“Phases of the ST&M Methodology” shows the progression of the five phases above. As mentioned earlier, although these phases can be used separately/individually, their cumulative use adds more value and power to the investigation. These phases are described in the following sections.
PHASES OF THE ST&M METHODOLOGY
Problem Structuring
In this phase, the situation or issue at hand is defined and the scope and boundaries of the study are identified. This is the common first step in most problem-solving approaches. However, the importance of this step is generally underestimated as managers and decision makers often assume that they readily know what the real problem is while in reality they may think about the problem symptom. The problem structuring phase consists of the following steps:
- Identification of the problem area or policy issues of concern to management, and identification of main stakeholders and their interests. (The seminal book on stakeholder analysis has been written by Freeman, 1984. Examples of stakeholder analysis for systems thinking applications are provided by Elias et al., 2002, and Cavana, 2004.) This step requires that we clearly establish the objectives, taking into account multiple stakeholders and perspectives. This step is most effective when performed in consultation with other stakeholders in a manner that encourages openness to new ideas and generates commitment and collaboration from the start.
- Collection of preliminary information and data including media reports, historical and statistical records, policy documents, previous studies, and stakeholder interviews that justify the seriousness and clarify the scope and magnitude of the problem/issue identified.
- The conduct of group sessions for creative problem structuring. Following the identification of the main issue or problems/opportunities of concern to management, bring the main stakeholders together, or separately, for a group creative problem structuring and/or group modeling session using the “affinity diagram” or “hexagon clustering” approaches.
Causal Loop Modeling
During this phase, conceptual models of the problem, known as causal loop diagrams (CLDs), will be created. Causal loop modeling is the most commonly used phase of the systems thinking approach. The following steps are used in causal loop modeling:
- Identify main (key) variables.
- Draw behavior over time charts (or reference modes) for the main variables.
- Develop causal loop diagrams (influence diagrams) to illustrate the relationships among the variables.
- Discuss behavior over time of the dynamics implied by the causal loop diagrams.
- Identify system archetypes that would describe high-level causal patterns.
- Identify key leverage points.
- Develop intervention strategies.
Dynamic Modeling
This phase follows the causal loop modeling phase. Although it is possible to go into this phase directly after problem structuring, performing the causal loop modeling phase first will enhance the conceptual rigor and learning power of the systems approach. The completeness and wider insights of systems thinking are generally absent from other simulation modeling approaches, where causal loop modeling does not play a part.
The following steps are generally followed in the dynamic modeling phase:
- Develop a high-level map or systems diagram showing the main sectors of a potential simulation model, or a “rich picture” of the main variables and issues involved in the system of interest.
- Define variable types (e.g., stocks, flows, converters, etc.) and construct stock-flow diagrams for different sectors of the model.
- Collect detailed, relevant data including media reports, historical and statistical records, policy documents, previous studies, and stakeholder interviews.
- Construct a computer simulation model based on the causal loop diagrams or stock-flow diagrams. Identify the initial values for the stocks (levels), parameter values for the relationships, and the structural relationships between the variables using constants, graphical relationships, and mathematical functions where appropriate. This stage involves using specialized computer packages like STELLA, iThink, VENSIM, POWERSIM, DYNAMO, DYSMAP, COSMIC or Consideo.
- Simulate the model over time. Select the initial value for the beginning of the simulation run, specify the unit of time for the simulation (e.g., hour, day, week, month, year, etc.). Select the simulation interval (DT) (e.g., 0.25, 0.5, 1.0) and the time horizon for the simulation run (i.e., the length of the simulation). Simulate model stability by generating steady state conditions.
- Produce graphical and tabular output for the base case of the model. This can be produced using any of the computer packages mentioned above. Compare model behavior with historical trends or hypothesized reference modes (behavior over time charts).
- Verify model equations, parameters, and boundaries, and validate the model’s behavior over time. Carefully inspect the graphical and tabular output generated by the model.
- Perform sensitivity tests to gauge the sensitivity of model parameters and initial values. Identify areas of greatest improvement (key leverage points) in the system.
- Design and test policies with the model to address the issues of concern to management and to look for system improvement.
- Develop and test strategies (i.e., combinations of functional policies, for example operations, marketing, finance, human resources, etc.)
Scenario Planning and Modeling
In this phase, various policies and strategies are formulated and tested. Here “policy” refers to changes to a single internal variable such as hiring, quality, or price. Strategy is the combination of a set of polices and, as such, deals with internal or controllable changes. When these strategies are tested under varying external conditions, this is referred to as scenario modeling. This stage involves working closely with all major stakeholders.
- Develop general scope, timeframe, and boundaries of external environment for scenarios. Prepare stories of possible futures or theme scenarios.
- Identify key drivers of change, uncertainties, and factors that could have a significant impact on the decisions, policies, and strategies being evaluated. Determine ranges for external parameters and graphs.
- Construct forced scenarios by placing all the positive outcomes in an optimistic scenario and all the negative scenarios in a pessimistic scenario. Check the forced scenarios for internal consistency. Modify these scenarios as learning scenarios (this step is based on the method outlined by P. J. H. Schoemaker, 1995).
- Simulate the scenarios (either the individual scenarios varying the key uncertainties or the learning scenarios) with the model. Redesign scenarios if necessary.
- Evaluate the performance of the policies and strategies with the model for each scenario. Assess the performance against a range of relevant performance measures for overall robustness. Select the policies or strategies that meet management’s objectives for the investigation.
Implementation and Organizational Learning
One of the most beneficial and enduring outcomes of systems thinking and modeling is team and organizational learning. Once simulation models have been developed, they can be enhanced by extending them into a microworld. Microworlds (also known as management flight simulators) provide an interactive and user-friendly interface for managers to experiment with the model. The learning laboratory uses microworlds in a structured process, akin to a scientific environment, to test hypotheses and mental models designed to create individual and group learning. The following steps summarize this phase:
- Prepare a report and presentation to the management team and other stakeholders. This should document the background and development of the systems thinking project the challenges faced, and the lessons learned.
- Communicate results and insights of the study and the reasons for the proposed intervention to all stakeholders.
- Develop a microworld and design a learning lab for the simulation model. This involves adding necessary features (i.e., from computer software) to convert the simulation model into an interactive and user-friendly microworld. Then design a learning lab process for the microworld.
- Use the learning lab process to diffuse and facilitate learning in the organization and with clients, decision makers, and other main stakeholders.
Systems Thinking and Modeling Applications
Systems thinking and modeling has a wide range of general and specific applications. Most of these are within the “knowable” region of the sense-making framework Cynefin developed by Kurtz and Snowden (2003) and others at the Cynefin Center for Organizational Complexity at IBM Global Services. (The name “Cynefin” is a Welsh word whose literal translation into English is “habitat” or “place.”) This region is shown at the top right-hand side of “The ST&M Methodology and the Cynefin Framework.”
Kurtz and Snowden (2003) define the knowable domain of their Cynefin sense-making framework as:
“While stable cause and effect relationships exist in this domain, they may not be fully known, or they may be known only by a limited group of people. In general, relationships are separated over time and space in chains that are difficult to fully understand. Everything in this domain is capable of movement to the known domain. The only issue is whether we can afford the time and resources to move from the knowable to the known; in general, we cannot and instead rely on expert opinion, which in turn creates a key dependency on trust between expert advisor and decision maker. This is the domain of systems thinking, the learning organization, and the adaptive enterprise, all of which are too often confused with complexity theory (Stacey, 2001). In the knowable domain, experiment, expert opinion, fact-finding, and scenario-planning are appropriate. This is the domain of methodology, which seeks to identify cause-effect relationships through the study of properties which appear to be associated with qualities. For systems in which the patterns are relatively stable, this is both legitimate and desirable.
THE ST&M METHODOLOGY AND THE CYNEFIN FRAMEWORK
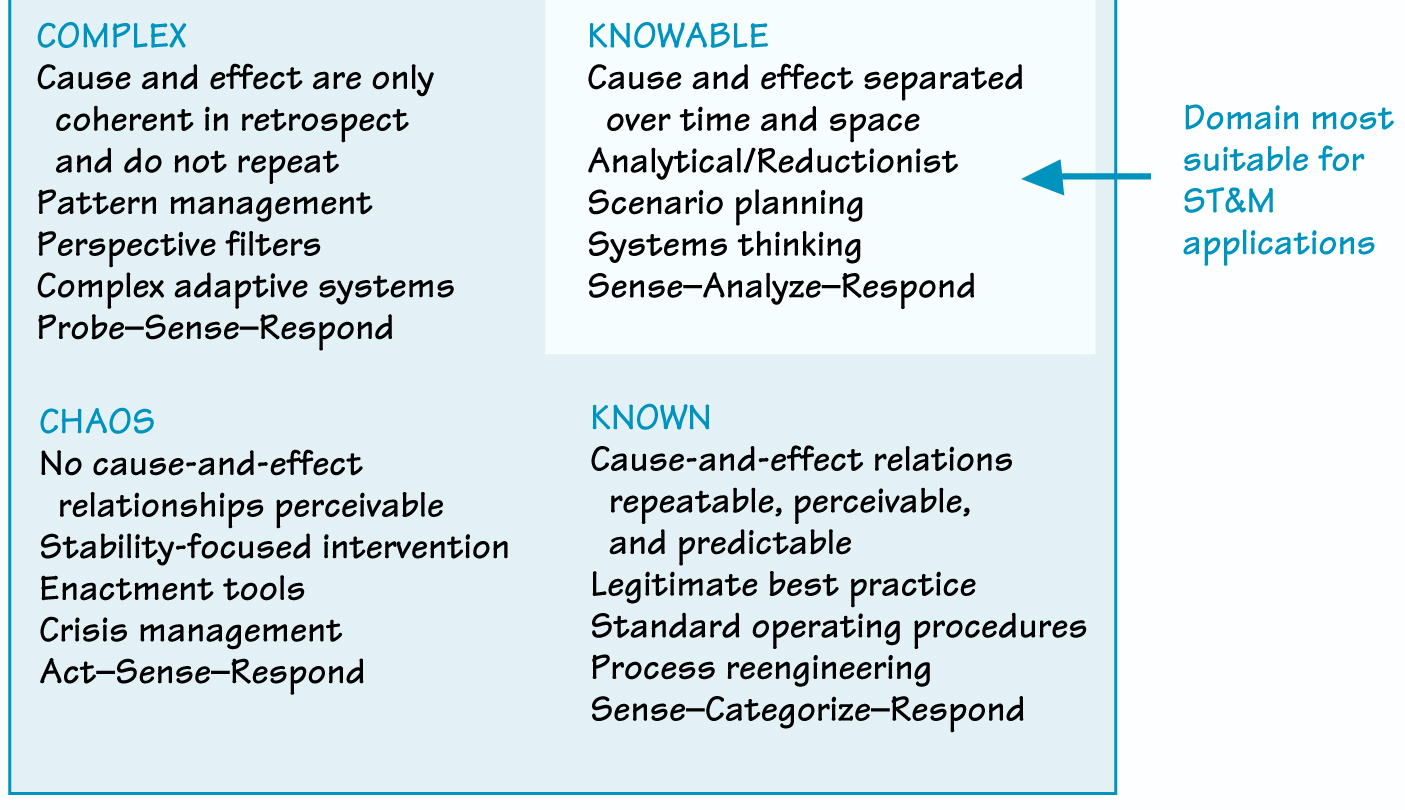
“Our decision model here is to sense incoming data, analyze that data, and then respond in accordance with expert advice or interpretation of that analysis. Structured techniques are desirable, but assumptions must be open to examination and challenge. This is the domain in which entrained patterns are at their most dangerous, as a simple error in an assumption can lead to a false conclusion that is difficult to isolate and may not be seen. It is important to note here that by known and knowable we do not refer to the knowledge of individuals. Rather, we refer to things that are known to society or the organization, whichever collective identity is of interest at the time.”
Examples of general applications of systems thinking and modeling are:
- design of new systems
- reengineering or improvement of existing systems
- prediction of behavior of complex systems under varying conditions
- understanding the interaction of component sub-systems
- strategy development and testing
- scenario modeling and testing
- group and organizational learning
The specific applications of the systems thinking and modeling methodology cover both strategic and functional aspects of business and organizations. Some of these are outlined below.
Strategy and Policy
Systems thinking and modeling is widely used for strategy formulation and testing. This occurs at the level of government and industry (e.g., healthcare, communication, regulation, etc.) as well as at the organizational level (e.g., marketing, production, human resources, finance, and their interfaces). Systems thinking highlights the following areas of strategy, which are often ignored or missed by other methodologies:
- internal contradictions in a strategy
- hidden strategic opportunities
- untapped strategic leverages
Operations and Design
Systems thinking and modeling also has widespread applications in operations and design. Traditionally, manufacturing systems have been a prominent area of application. Service industries such as healthcare, communications, and logistics are the upcoming areas that readily lend themselves to the application of systems thinking and modeling. Some of the specific applications are:
- new product and service development
- supply-chain management
- enterprise resource planning (ERP)
- network design and management
Functional Modeling
In addition to the areas mentioned above, the systems thinking and modeling methodology can be used to model functional areas such as finance, marketing, information technology, and human resource management.
Hard and Soft Modeling/Thinking
It is important to clarify the meaning of the terms model and modeling in this context. Model is defined as being a representation of the real world. Models can take on different forms – physical, analog, digital (computer), mathematical, and so on. This sense of the word model is the more traditional one and is sometimes referred to as quantitative or “hard.” More recently, the concept of soft modeling has been developed by Checkland and others (Checkland, 1981). Soft modeling refers to conceptual and contextual approaches that tend to be more realistic, pluralistic, and holistic than “hard” models. Hard and soft models are sometimes referred to as “quantitative” or positivist and “qualitative” or interpretivist, respectively (Cavana et al., 2001). The differences between the hard and soft approaches are summarized in “Hard Versus Soft Approaches”.
The methodologies presented cover both hard and soft approaches because we regard these approaches as complementary and mutually reinforcing. Systems thinking tends to fall in the category of soft approaches, while dynamic modeling gravitates toward the category of hard modeling.
In the following sections, two other approaches to systems thinking are outlined. These are soft systems methodology and cognitive mapping. While these approaches are most useful in the problem-structuring phase of systems methodology, their potential use is much wider.
Soft Systems Methodology
Another approach to systems thinking, known as soft systems methodology (SSM), originated in the U. K. (Checkland, 1981). Soft systems methodology is based on the notion that human and organizational factors cannot be separated from problem solving and decision making. Thus SSM takes a systems view of the organization (Pidd, 1996). Soft systems methodology consists of seven interrelated stages. These stages are listed below and shown in “Soft Systems Methodology”.
-
- The problem situation is unstructured.
- The problem situation is expressed.
- Root definitions of relevant systems are identified.
- Conceptual models are developed.
- The problem situation (stage 2) and the conceptual models (stage 4) are compared.
- Feasible and desirable changes are considered.
- Action is taken to improve the problem.
These stages are conceptually similar to the seven-step method or the plan-do-check-act (PDCA) process of quality management (Shiba et al., 1994). The focus of SSM on root definition is also analogous to the PDCA model’s root-cause analysis (i.e., the cause-and-effect or “fishbone” diagram). In essence, like quality management methods, SSM provides a powerful learning process for individuals as well as for groups and organizations.
A key feature of the second stage of the SSM process is the development of a “rich picture,” which is a “pictorial, cartoon-like representation of the problem situation that highlights significant and contentious aspects in a manner likely to lead to original thinking at stage 3 of SSM” (Jackson, 2003).
Cognitive Mapping and SODA
Cognitive mapping and strategic options development and analysis (SODA) were developed by Eden and his colleagues (Eden et al., 1983; Eden and Ackermann, 2001; Ackermann and Eden, 2001). This approach focuses on how individuals view their world and how they behave within the organization (Pidd, 1996), thus it is more individualistic than the SSM approach.
The main premise of Eden’s approach is that desirable outcomes are the product of both content and process (i.e., the end and the means). This means that, in organizations, the effectiveness of policies and strategic plans, for example, depends not only on the plan itself or the apparent results, but also on how the plans are arrived at because this determines people’s commitment to organizational plans and decisions.
Cognitive maps are tools for thinking and problem solving. They are intended for unraveling mental models and mapping how people think about a certain issue or problem. The main building blocks of cognitive maps are called “concepts.” The concepts are generated during an interview process using the words used by the interviewee (Pidd, 1996). These concepts or ideas are then linked together by arrows to form a cognitive map, as illustrated in this sustainable tourism example.
Although cognitive maps and causal loop diagrams – one of the main tools of systems thinking – are somewhat similar visually, they are distinctly different both conceptually and methodologically (Richardson, 1999). In the first place, the “concepts” used in cognitive mapping are phrases that often contain comparative adjectives (e.g., better, bigger, fewer, less). On the other hand, the “variables” used in causal loops are nouns that have “quantities” associated with them (e.g., demand, supply, quality, motivation, etc.). In the second place, the linkages in cognitive maps are not “closed” and hence loops tend not to arise in cognitive maps. In causal loop diagrams, however, loops are the mainstay of the method, indicating dynamic and recurring patterns.
When more than one individual is involved, the SODA methodology is used to create group commitment, especially with a focus on action. This is based on the premise that in order for people to work as a team and create a shared understanding, it is essential that they should be jointly involved in problem definition and the search for ways in which to solve problems (i.e., strategy formulation). SODA methodology moves people through a process of debate and negotiation towards a joint commitment to action (Pidd, 1996).
While there are differences between SSM and cognitive mapping, “neither assumes that an organisation is a machine, which grinds on its way regardless of the people who compose it” (Pidd, 1996). The problem structuring phase of the five-phase ST&M process is consistent with and emphasizes this approach.
Kambiz E. Maani is an international expert on systemic approaches to organizations and leadership. He is an author and inspirational speaker on systems thinking, complexity management, and organizational learning and leadership. Currently, Kambiz is an associate professor of management and systems sciences at the University of Auckland Business School, where he has held several leadership roles.
Robert Y. Cavana is a reader in systems science with the Victoria Management School at the Victoria University of Wellington, New Zealand. He was previously a president of the Operational Research Society of New Zealand and a vice president of the International System Dynamics Society; he is currently a managing editor of the System Dynamics Review.
This article is adapted with permission from Chapter 2 of Systems Thinking, System Dynamics: Managing Change and Complexity, Second Edition (Pearson Education New Zealand, 2007).