It’s Monday morning. You’ve just settled in at your desk to catch up on some reading, when the phone rings. The program manager of the Superfast Computer is on the other end: the prototype scheduled for tests today is not ready. When you follow up to see what’s going on, you discover it is more than just one or two missing parts—almost one-third is not ready!
How did this happen? All your planning schedules seemed up-to-date, and there were no indications of delays. Now each of the departments is blaming the others: “If only they had given me x on time…” “If only the packaging group had let me know when they first knew they were falling behind…” Now you will have to hassle the different departments to get the parts out as quickly as possible, like you did with the last program. But you thought the problem had been solved—the company made it clear that late parts and missed target dates would not be tolerated. In fact, severe penalties were out-lined. What happened?
Fixes for Falling Sales
The Problem-Solving Treadmill
The above scenario is typical for many people caught on a problem-solving treadmill. The “Fixes that Fail” archetype provides a starting point to help you get off the treadmill by identifying “quick fixes” that may be doing more harm than good (see “Fixes that Fail: Oiling the Squeaky Wheel — Again and Again…” November 1990). The central theme of this archetype is that almost any decision carries long-term and short-term consequences, and the two are often diametrically opposed.
In the case of the product launch, the fix that was meant to keep everyone on target actually made things worse. Penalizing those who missed deadlines created a dynamic where no one dared reveal that they were running late. If no one was “discovered” before a critical deadline (like prototype test), then everyone would be discovered at the same time, and no one person or team could be singled out. After that crisis was addressed, schedules would be stressed even more and penalties for failure would be increased…again. The result: programs are continually run with inaccurate information, creating rework and further hurting the schedule.
Getting off the problem-solving treadmill starts with becoming aware of how one is operating in such a structure. What follows is a seven-step process for mapping out the systemic consequences of quick fixes and for identifying high leverage actions.
1. Start with the Problem Symptom (and only the symptom)
Oftentimes we confuse “problem solutions” with problem symptoms. We are so used to responding to certain types of problems that we begin to see the lack of our solutions as being the problem. Problem solution statements like “The problem is….we need a bigger sales force,” or “The problem is…we don’t have the latest order processing system,” can lead you right back on the problem-solving treadmill.
It is important to spend some time up-front defining the problem symptom. This will force you to understand the problem as separate from any actions that you have taken, are taking, or plan on taking. Try turning problem solution statements such as “lack of sales training” into problem symptom phrases like “falling sales volume.”
2. Map Current Interventions
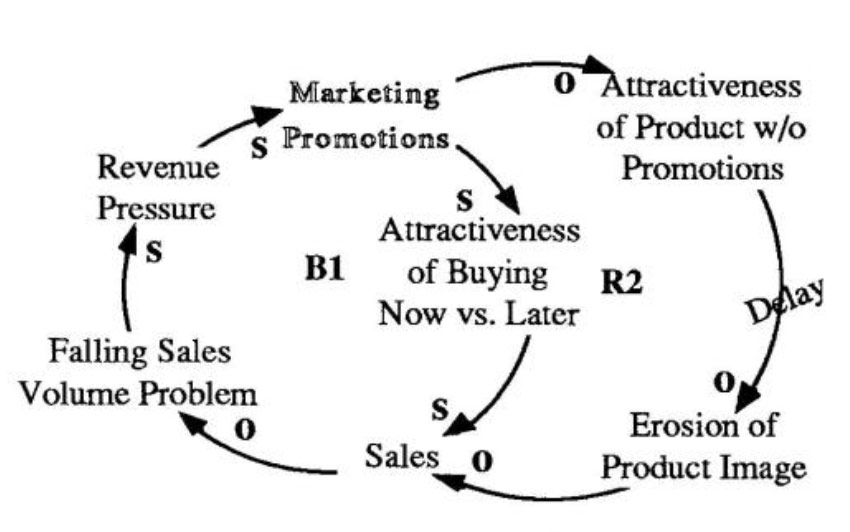
After you have clarified the problem, you can map out various past “solutions,” as well as current and planned actions. This is where you may include your favorite solutions such as sales training, marketing promotions, advertising campaigns, etc. In each case you want to draw out how the interventions will rectify the problem. For example, marketing promotions make it more attractive to buy now vs. later, which leads to higher sales (loop B1 in “Fixes for Falling Sales” diagram).
By following the discipline of clearly articulating how your actions affect the problem, you create an explicit map of your causal assumptions. The output of this mapping process can be used to show others how you understand the problem, and invite them to add to or modify the diagram from their point of view.
3. Map Unintended Consequences
One action can produce multiple consequences. People are usually good at recognizing the intended results, but not as good at identifying the unintended consequences. Use the causal diagram to map out potential side-effects of any actions you have taken to rectify the problem.
For example, one danger of repeatedly using marketing promotions to boost sales volume is that the products become less attractive when they are not accompanied by promotions. Over a period of time, product image erodes and sales decline. This exacerbates the sales volume problem, which then justifies the use of more marketing promotions (R2). This tendency of the system to reinforce the need to take the same actions again and again is at the heart of “Fixes that Fail.”
4. Identify Loops that Create Problem Symptoms
Treating symptoms can become a full-time job, since each set of fixes creates new symptoms that beg to be “solved.” To stop the treadmill, however, we must identify what is causing the problem in the first place. This search for the fundamental cause may lead to very different questions. Instead of looking for ways to solve a “falling sales problem,” for example, we should try to understand what factors directly affect sales (aside from the fixes we have already proposed).
Some root causes may include quality of customer service, number of new products, manufacturing lead times, or product quality. As you explore the root causes of falling sales volume, for example, you may discover that the number of new products has been declining in recent months. The next question to ask is: “How is the problem symptom connected to the number of new products (or any of the other potential root causes)?” You may find that in response to revenue pressure in the past, investments in new products were curtailed. The effects of that decision are now being seen in the reduced number of new products, which further aggravates the falling sales volume (R3 in “Shifting Emphasis to Marketing Promotions”).
5. Find Connections between Both Sets of Loops
Oftentimes, “fixes” and fundamental causes are linked together in ways that further reinforce the continued use of the fixes. Identifying the links can highlight the many ways fixes can get entrenched in a company’s routine.
Shifting Emphasis to Marketing Promotions
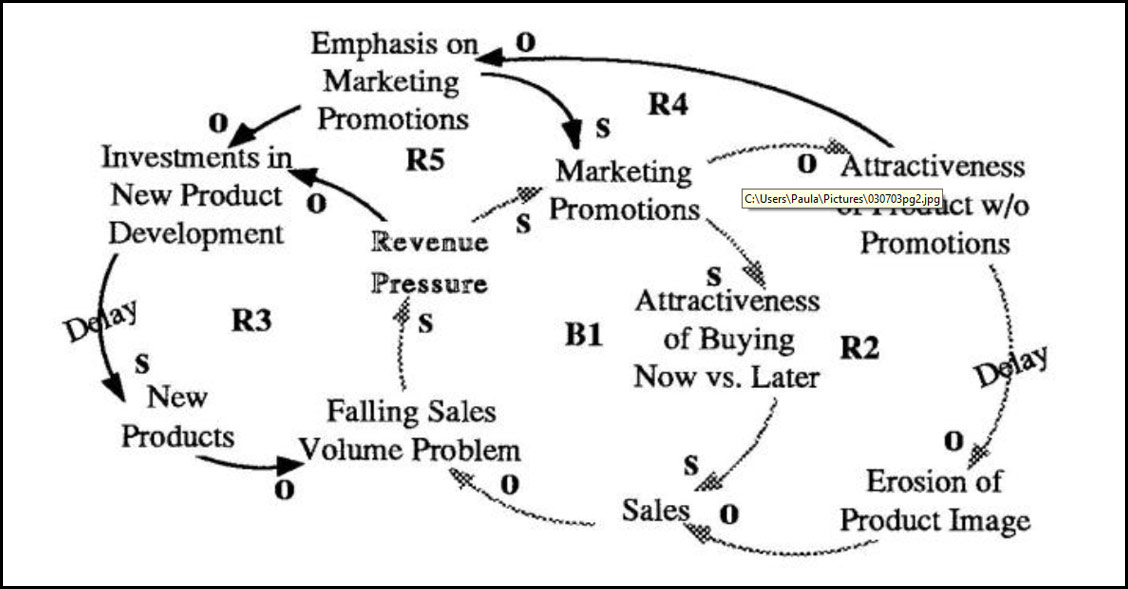
As product attractiveness relies more on promotions, the emphasis on promotions increases. This leads to more promotions (R4) and lower investments in new product development (R5), which will further exacerbate the falling sales volume (R3).
In our marketing example, as the product attractiveness depends more on promotions, emphasis on promotions will increase, leading to more promotions (R4). Investments in new product development, on the other hand, will be reduced as the company shifts its attention to marketing (RS). The resulting diagram looks similar to a “Shifting the Burden” archetype, as the company grows more dependent on marketing promotions to push sales. (A “Fixes that Fail” structure usually carries the seeds of a “Shifting the Burden”).
6. Identify High Leverage Interventions
Identifying high-leverage interventions usually means cutting or adding links in the causal maps. These actions represent structural interventions that will alter the policies that affect how people make decisions and take action.
Cutting the links from “revenue pressure” and “emphasis on marketing promotions” to “investments in new product development,” for example, decouples investment decisions from other responses to falling sales volume. On the other hand, adding a link between “erosion of product image” and “investments in new product development” can channel important market information that can be used to enhance the product’s appeal.
7. Map Potential Side Effects
For every contemplated intervention, try to identify side-effects that may be undesirable (using steps 3-4 above). By mapping them in advance, you can better prepare to respond or perhaps design around them altogether.
Summary
The preceding seven steps are meant as guidelines (not a rigid set of rules) for systematically mapping out the multiple consequences of actions. The resulting diagrams can help clarify the critical issues and provide a common, shared understanding of the problem in order to design more effective and long-lasting solutions.