Imagine you’re leaving on a six-hour flight from Boston to Los Angeles. As the plane pulls away from the gate, the pilot comes on over the loud-speaker. “Hi, I’m Captain Bob, and I want to thank you for choosing to fly with us today…just wanted to let you know I’ve recently completed my ground school training, and I have read all the manuals, but this is my first time in the cockpit. So sit back, relax, and enjoy the flight, as we learn together…”
Of course this scenario is ludicrous — a pilot is allowed into a cockpit only after hundreds of hours of experience in a flight simulator. Then he or she spends many additional hours as a co-pilot, assisting in the operation of an aircraft. The result of this careful system of education and training is an industry with the highest safety record of any mode of transportation.
Flight Training for Managers
Imagine if we trained pilots like we do managers; how many people would be willing to take a flight? Managerial training, in the traditional business-school sense, is the equivalent of the ground-school for pilots. Managers-to-be read textbooks and solve already-formulated problems, but they don’t get much real experience before they have to perform on-line.
Management Flight Simulators
Management Flight Simulators (MFS) provide a simulated environment in which managers can “learn from experience” in a controlled setting. The simulator captures the interconnections between the different parts of the system under study and provides a computer interface which allows managers to interact with the model through a familiar “lens” (reports, graphs, and spreadsheets).
Similar to a pilot’s flight simulator cockpit, an MFS puts managers in control of a realistic environment where they are in charge of making key decisions similar to the ones they face in their actual work settings (see “Systems Thinking in Action” on page 7 for an example of an MFS project). MFS’s are particularly useful for getting away from the details of day-to-day operations and focusing on the long-term dynamics of managerial decisions.
Creating a Flight Simulator
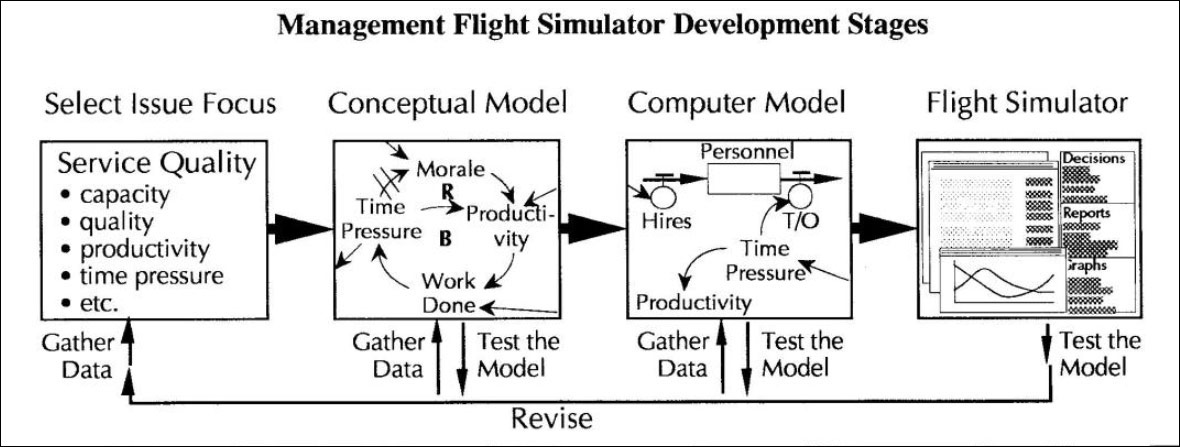
There are four stages involved in creating a management flight simulator: (1) selecting an issue focus, (2) developing a conceptual model, (3) constructing a computer model, and (4) translating the computer model into an interactive simulator (see “Management Flight Simulator Development Stages” figure). These four stages involve integrating many of the tools of systems thinking into a single, powerful learning tool (see “A Palette of Systems Thinking Tools,” August 1990 for a description of each of the tools).
1. Select Issue Focus. The first step in designing a flight simulator is to choose an issue to explore. To select a topic, look for a problem symptom that has been around for a long time or a puzzling dynamic you want to investigate (see “The Do’s and Don’t’s of Systems Thinking on the Job,” August 1992, for guidelines on identifying good systems problems). The goal at this stage is to gather relevant data through interviews, company records, and the experience base of those involved in developing the MFS.
Management Flight Simulators Development Stages
In a classic “Success to the Successful” scenario, the greater the rich’s (A’s) access to the factors governing production, the greater their ability to generate still more resources and control even more production inputs (RI). Poor people (B) are thus able to control less and less of the world’s resources (R2).
For example, let’s say we are puzzled by a pattern of oscillating quality levels in the customer service department. Interviews with people in the department reveal a pattern of tremendous time pressure that repeats in a regular cycle. Company data provide a record of steadily rising sales and irregular levels of customer satisfaction. This process grounds the project in real data from which to build a causal theory.
2. Build Conceptual Model. After selecting an issue focus, you can begin to build a conceptual model that organizes the data into a coherent dynamic theory. Systems archetypes and canal loop diagrams (CLDs) can be very helpful for trying to understand what is going on (see “Systems Archetypes at a Glance,” May 1992, and “Guidelines for Drawing Causal Loop Diagrams,” February 1992).
In the customer service quality example, we can start building causal structures that provide plausible explanations for the observed data when customer demand increases, we know our service people feel added pressure. If the increase in time pressure is not addressed, quality tends to drift downwards and eventually dampens demand (B1 in “Time Pressure Loops”).
Time Pressure Loops
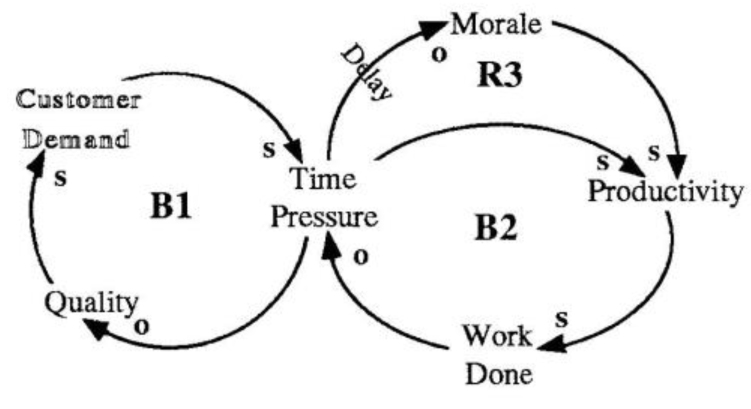
Our service people tell us people initially respond to the time pressure by working harder, thereby increasing productivity and getting more work done (B2). If the time pressure persists, however, morale declines and begins to hurt productivity even though people continue to work harder. As time pressure escalates, morale spirals downward (R3). By adding additional loops, we can continue building a dynamic theory about our customer service setting.
3. Construct Computer Model. The dynamic theory developed in the conceptual model helps guide the construction of a computer model. It provides a framework for people to distill their experience into explicit statements that can be represented in a computer model. Just as the pilot’s flight simulator is created based on the laws of physics and aerodynamics, the computer modeling process uses a set of fundamental building blocks (e.g., accumulators and flows) to represent a coherent set of theories about the interconnections in an organization.
In the customer service quality ex-ample, we could model the number of “personnel” as an accumulator and “hires” and “turnover” as inflows and outflows, respectively. The effect of time pressure on turnover may be modeled using a graphical function diagram representing a non-linear link between the two variables. That is, there may be little or no negative effects at low levels of pressure, but beyond a certain threshold, there may be a sudden dramatic increase in turnover.
4. Translate to Flight Simulator. Pilots first learn about the principles and concepts of aviation in school and then use the simulator to gain a better understanding of how those principles actually play out in real-life situations. Likewise, a management flight simulator is created by translating the “principles” captured in the computer model into a form that allows managers to interact with it in a realistic way.
A good simulator interface should provide managers with a set of decisions that either they have control over, or that directly affect them. The main criteria should be that the decisions are directly relevant or easily transferable from the simulator to the workplace.
In the service quality example, the simulator could require managers to make decisions about hiring/firing, monthly production numbers, and quality standards. By implementing a “Quality First” policy, for example, we may discover if we raise quality standards but don’t adjust capacity, we actually end up with lower quality in the long run. Quality improves in the short run, but as time pressure persists, morale decreases, turnover increases, which in turn increases time pressure, resulting in more turnover. The overall dynamic is a vicious reinforcing cycle in which capacity continually erodes and quality suffers.
In the Next Issue
The simulator should also provide managers with the same type of reports, spreadsheets, and graphs they use to make decisions. There are many issues involving the design of the simulator’s management information system which are entwined with the intended use of the MFS as a whole. These and other issues about the purpose, use, and outcomes of MFS’s will be covered in Part 2.
For help on converting conceptual maps to computer models, see “Accumulators: Bathtubs, Bathtubs Everywhere,” February 1991; “Structural Thinking: The World According to Accumulators and Flows,” March 1991; and “Graphical Functions: ‘Seeing’ the Full Story,” September 1991. To learn more about constructing computer models, see Introduction to System Dynamics Modeling with DY-NAMO (Cambridge, MA: Productivity Press), and Academic User’s Guide to STELLA (Hanover, NH: High Performance Systems).