The recent SARS (Severe Acute Respiratory Syndrome) outbreak in Toronto, Canada, and its handling by the media, local health authorities, and the World Health Organization (WHO) provide a case study of how raw data can obscure reality. This crisis also highlights the potential usefulness of a stock and flow framework to make sense of ever-changing information about a critical public issue. A clear and rigorous way to report and interpret data about the spread of infection would help people accurately assess the level of risk and avoid socially and economically disruptive reactions driven by ignorance and panic.
A New Threat
SARS emerged this year as a previously unknown virus that is particularly virulent—it is easily spread and can be deadly. Because it kills approximately 15 percent of those infected—the rate is even higher among the elderly—health officials around the world have taken strong steps to mitigate the epidemic and to prevent the public from panicking. In Canada, the great majority of cases were concentrated in Toronto, the country’s largest city and capital of the province of Ontario. From its first news release on March 14 to the latest daily updates on the situation, the Province of Ontario’s Ministry of Health and Long-term Care (MoH, the main governmental department responsible for dealing with the outbreak) sought to inform the public about the progress of the disease and the measures taken to deal with it. Now that the outbreak in Toronto has been suppressed, we can appreciate the impact of this information on public perceptions of and reactions to this health crisis.
A clear and rigorous way to report and interpret data about the spread of infection would help people accurately assess the level of risk.
One element of the daily updates was the summary of relevant statistics on the number of cases of the disease. In keeping with the WHO’s style of reporting on epidemics, the MoH bulletins reported cumulative numbers, in this case the total numbers of probable and suspected cases and deaths to date. Each day, the media reported this cumulative total; some later reports also mentioned cumulative recoveries (referred to as discharges).
I can attest that it was difficult to know how bad the situation was becoming from the raw information being offered. Reporters did little to interpret the data, instead publishing stories about the public’s and their own reactions to the outbreak, to the problems of living under quarantine, and to the few cases of people breaking quarantine. The use of cumulative numbers of cases, discharges, and deaths—numbers that can only increase until the epidemic has run its course—was often confusing and misunderstood. Such information gave no sense of the progress of the disease for example, whether the numbers of cases or deaths per day were increasing, staying the same, or decreasing.
The MoH did eventually include the category of “active” cases in its reports, which gave the public a sense of how many people were currently infected. But confusion was heightened by occasional instances in which the MoH reported tens or even hundreds of potential cases with no clear indication of whether these numbers fell into the active or cumulative category. For the public, this confusion led to the panicked buying of high-quality respiratory masks, cancellation of several large conventions, reduced participation in social activities like sports and cultural events, and a slump in restaurant dining and tourism, with economic side-effects that are still being felt.
A Simple Model
In such public health crises, a simple stock and flow model could clarify the situation (see “Stocks and Flows of the SARS Epidemic”). The stocks would be the “Active” cases— “Probable” and “Suspect.” Their principal inflows would be “New Cases” of each sort discovered each day. The outflows would be the number of “Deaths” (a small figure; the total number in Toronto is 24 as of this writing) and the number of people who recovered from the disease each day, reported as “Discharges.” A final flow from “Suspect” to “Probable” cases would take care of the clinical difference between the two classes.
This model would define the primary data needed to represent different aspects of the outbreak:
- Its onset and its gathering speed with the number of new cases per day.
- Its control and eventual suppression when the number of new cases stays at zero for 20 days (twice the incubation period) and the number of active cases dwindles to zero.
- The requirements for treatment resources based on the number of active cases.
- The treatment success rate as shown by the number of discharges compared to the number of deaths.
All of this information is much more difficult, if not impossible, to assess directly from the current data stream provided by the standard reporting practices. It is not clear what part these difficulties in assessment played in the WHO’s unexpected and unprecedented decision to issue a travel advisory for Toronto (since rescinded). Nevertheless, confusion about the success that public health authorities were having in controlling SARS was certainly part of the issue and continues to inspire efforts to remove the stain on the city’s reputation as a safe place to visit and conduct business.
STOCKS AND FLOWS OF THE SARS EPIDEMIC
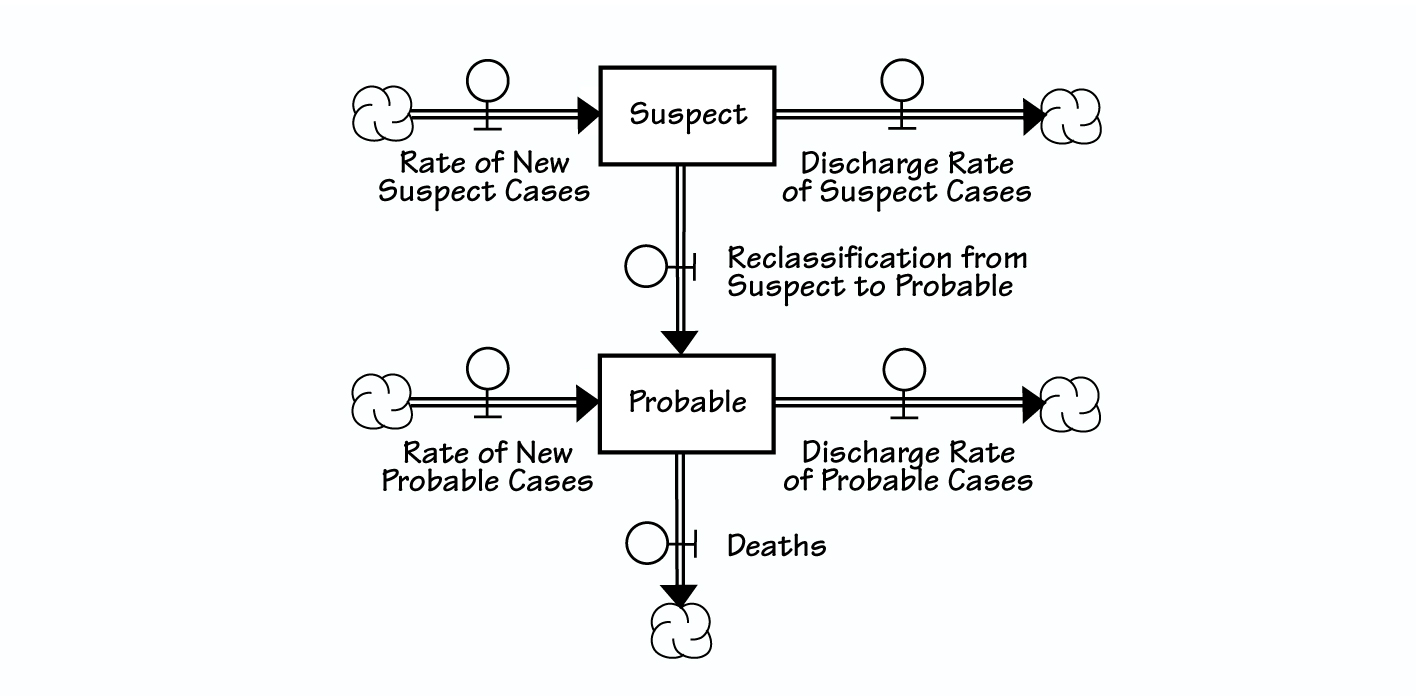
In a public health crisis, a simple stock and flow model could clarify the situation by distinguishing between the stock variables (“Suspect” and “Probable”), which give a snapshot of the situation at any given moment, and the flow (or rate) variables, which explain the day-to-day variations in the picture. For more information about stock and flow diagrams, go to www.pegasuscom.com/stockflow.html.
The discovery of a few suspect cases of SARS in Toronto on May 22 and the extension of the voluntary quarantine to a few hundred people demonstrate another element of the dynamic structure—potential but undetected cases. This category exists because of the lack of a precise test for the disease. Without an objective measure of who does or doesn’t have SARS, healthcare workers must make judgments, for example, that an elderly patient suffering from postoperative pneumonia does not have SARS, followed by a realization several days later that this patient does indeed have the disease. Unfortunately, this kind of significant delay in the discovery of problematic cases can perpetuate the epidemic and lead to large social and economic costs.
Using a simple stock and flow model to depict the course of future epidemics could better inform the public so they could make wise individual choices about how best to respond to the health threat.
Wise Choices
This model or a slightly more elaborate version could have reduced some of the confusion surrounding the raw, cumulative data reported during the outbreak. It would have clarified the important distinction between the stock variables, which give a snapshot of the situation at any given moment, and the flow variables, which explain the day-to-day variations in the picture. The usefulness of the stock and flow model is validated by the most recent news reports on the final success of the campaign. These reports include a graphical representation of the number of active cases. The diagram shows a downward trend at a varying rate since the peak of SARS cases on April 18 to May 15, the date of this writing. Such a graphic goes far in highlighting the pattern over time of the outbreak.
Finally, the stock and flow model would identify the important variables—the flows (“New Cases,” “Discharges,” and “Deaths”)—that have to be managed in order to control the outbreak and deal with its economic and social side-effects. For example, an increase in “New Cases” that is not soon matched by an increase in “Discharges” could be a signal to increase resources for treatment (“Discharges”) and quarantine (“New Cases”). Reports of decreasing numbers of active cases should be accompanied by estimates of the probable numbers of deaths or, more positively, by estimates of the probable number of recoveries so as not to give the false impression that success in suppressing the outbreak means no more casualties.
Toronto, like Vietnam before it and more recently Singapore, has shown that SARS can be contained by vigorous efforts to identify and isolate patients (in hospital or in quarantine). Using a simple stock and flow model to depict the course of future epidemics—such as the summertime threat of West Nile virus in North America—could better inform the public so they could make wise individual choices about how best to respond to the health threat.
R. Joel Rahn is recently retired as a professor in the Department of Operations and Decision Systems at Laval University. He has been active in teaching and research in system dynamics for over a quarter century.