Once you have a basic knowledge of stocks and flows, you can begin converting CLDs to stock and flow diagrams. The steps we describe below provide a strong foundation for understanding the connections between CLDs and stocks and flows and add order to an often chaotic process (see “Converting CLDs to Stocks and Flows” on p. 8). In addition, the process reinforces the stock and flow way of thinking by emphasizing the difference between information and material flows, and the importance of unit consistency throughout a diagram. Although these instructions assume use of one of the inexpensive computer-based modeling packages currently available, you can also draw stock and flow diagrams by hand. However, by using a modeling program, the end result of the conversion process will be a computer model that you can use to experiment with different policies and see how the system might respond.
The conversion process includes the following steps:
Specify the Units of All CLD Variables
The process starts with a simple question that lays the groundwork for the later steps: What are the units of each variable in the diagram? Specifying the units serves several important purposes:
- It makes thinking about the causal loop more rigorous, which is an important step toward stock and flow thinking.
- It helps determine which variables are going to involve time and will therefore likely be flows.
- It provides the basis for determining what variables are missing and will need to be added later in the conversion process.
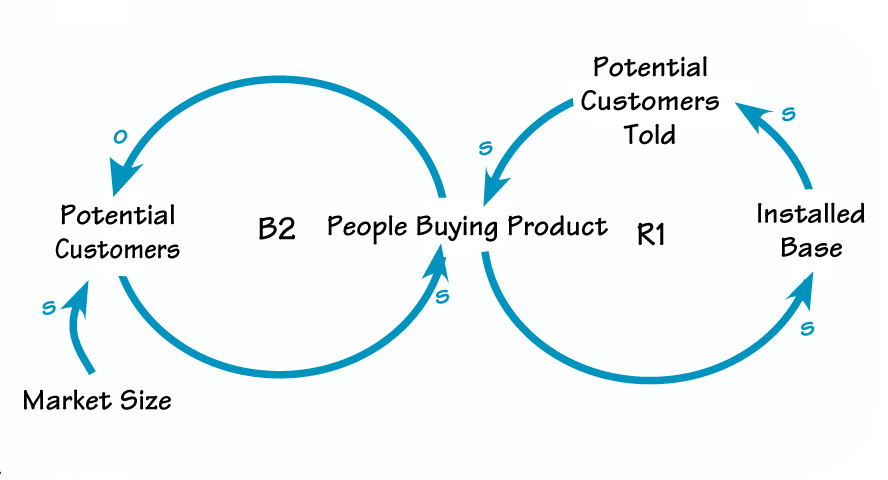
For example, in the causal loop diagram below of a product life cycle, the unit for Installed Base, Potential Customers, and Market Size is people. The unit for People Buying Product is people per month.
Identify and Create the Stocks
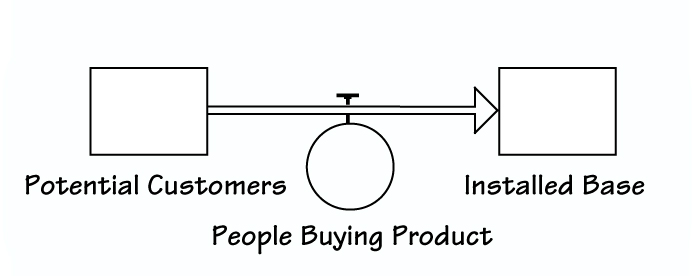
The next step is to determine which CLD variables are stocks. The previous step of specifying the units helps facilitate this process by indicating which variables involve time and, therefore, are probably flows. (Note, however, that just because a variable is a function of time does not necessarily mean that it is a flow; it depends on the CLD’s overall function). Double-check your ideas about which variables in the CLD are stocks — and identify any additional stocks that might be needed — by following the guidelines given in Part I of this series. In the product life-cycle example, the two stocks are Potential Customers and Installed Base.
Identify and Create the Flows
Once you have identified the stocks, it is easy to identify the flows: They are simply the variables that add to or subtract from the stocks. Only a flow can increase or decrease a stock, so if a variable is directly influencing a stock and is a function of time, it’s a good bet that it’s a flow. In our example, the only flow is People Buying Product.
Connect Flows to Stocks and Stocks to Flows (if Necessary)
The first task in this step is to connect all flows to the stocks that they influence. If the flow has a negative effect on the stock, then it’s an outflow; if it has a positive effect, it’s an inflow. For example, as the flow People Buying Product increases, the stock Installed Base increases, because People Buying Product is an inflow to Installed Base. On the other hand, as the flow People Buying Product increases, the stock of Potential Customers declines.
Once you have connected all of the flows to their stocks, you may need to connect certain stocks to flows. This is necessary if a stock influences one or more flows through an information link. In a CLD, the same kind of link can carry either material (e.g., units assembled) or information (e.g., interest rate). In a stock and flow diagram, however, material and information links are separate. In our case, neither of the stocks is directly linked to People Buying Product by an information link.
Add and Link Remaining CLD Variables
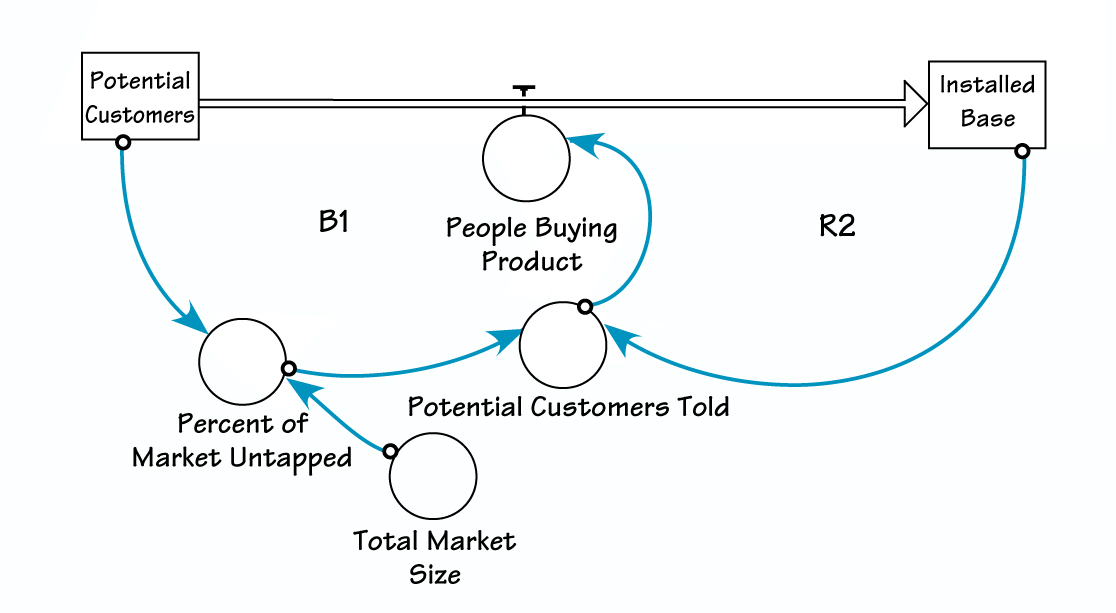
In this step, add any CLD variables that you did not previously identify as stocks or flows. These “auxiliary” variables are of two types: variables whose value does not change at all over the time period you are interested in — called “constants” — and variables that simply represent calculations based on stocks and flows. For example, in the product life-cycle diagram, Total Market Size is an auxiliary variable that is a constant (for simplicity, we assume the size of the market does not change). Percent of Market Untapped is an auxiliary variable that represents a calculation: Potential Customers divided by Total Market Size.
Connect the new variables to the variables that they influence and to those that they are influenced by. Note that stocks can affect auxiliary variables (e.g., Potential Customers affects Percent of Market Untapped), but these variables cannot affect stocks — stocks can only be influenced by flows. If it seems that the variable must be affecting a stock, then you need to determine if it is a flow that you overlooked earlier.
At this point, your initial pass at creating the stock and flow diagram is done (see “The First Iteration”). However, the conversion process is iterative; you will likely need to go through further rounds of defining and creating variables before the diagram is complete. In addition, one key way in which the diagram still needs to evolve is in making it calculable, which means that the value of all stocks and flows can be calculated from the information in the diagram. Although a CLD expresses how one variable is related to another, it does not provide enough detail to calculate the value of one variable given the values of the others. In contrast, a stock and flow diagram is a calculable representation of the system. For this to be possible, each variable must be defined and assigned the correct units, and often new variables must be added as well.
Define Stocks and Flows and Check Units
Formally defining variables entails specifying the equation that allows you to calculate the value of a given variable when you know its initial value and the values of the other variables in the diagram. For example, Installed Base is defined as the initial installed base plus the inflow People Buying Product. During the definition process, you may discover additional variables required to ensure that the units of input match the units of output.
Start with the stocks, which are usually the easiest to define. Because they are calculated by adding the effects of the inflows and the outflows to the amount already in the stock (i.e., they accumulate the effects of the flows), all they require is an initial level (how much they have to begin with) and defined units. You can use the work you performed earlier on specifying units again in this step. Ask yourself: Are the stocks accumulating the right material? For example, in the product life-cycle example, if Installed Base accumulates dollars and People Buying Product is measured in people, then the units of Installed Base are wrong.
The next step is to define the flows and then check the units they use. In our example, the flow People Buying Product is measured in people per month. It flows into the stock Installed Base, which measures the total number of people who have bought the product. If instead People Buying Product were measured in units of people per hour, but the smallest “slice” of time (often called the “time step”) that you wanted to think about was a month, then you would have to change the time increments from people per hour to people per month. Defining units for the flows may also lead you to discover other variables that need to be included in the diagram.
Create and Link Any Additional Variables
Once you have determined that the stocks and the flows have the proper units, you need to examine the other variables. The process for defining the remaining variables and checking for unit consistency is the same as the one described above for defining the flows. Again, you may discover the need for even more variables, beginning another iteration of defining variables and checking units.
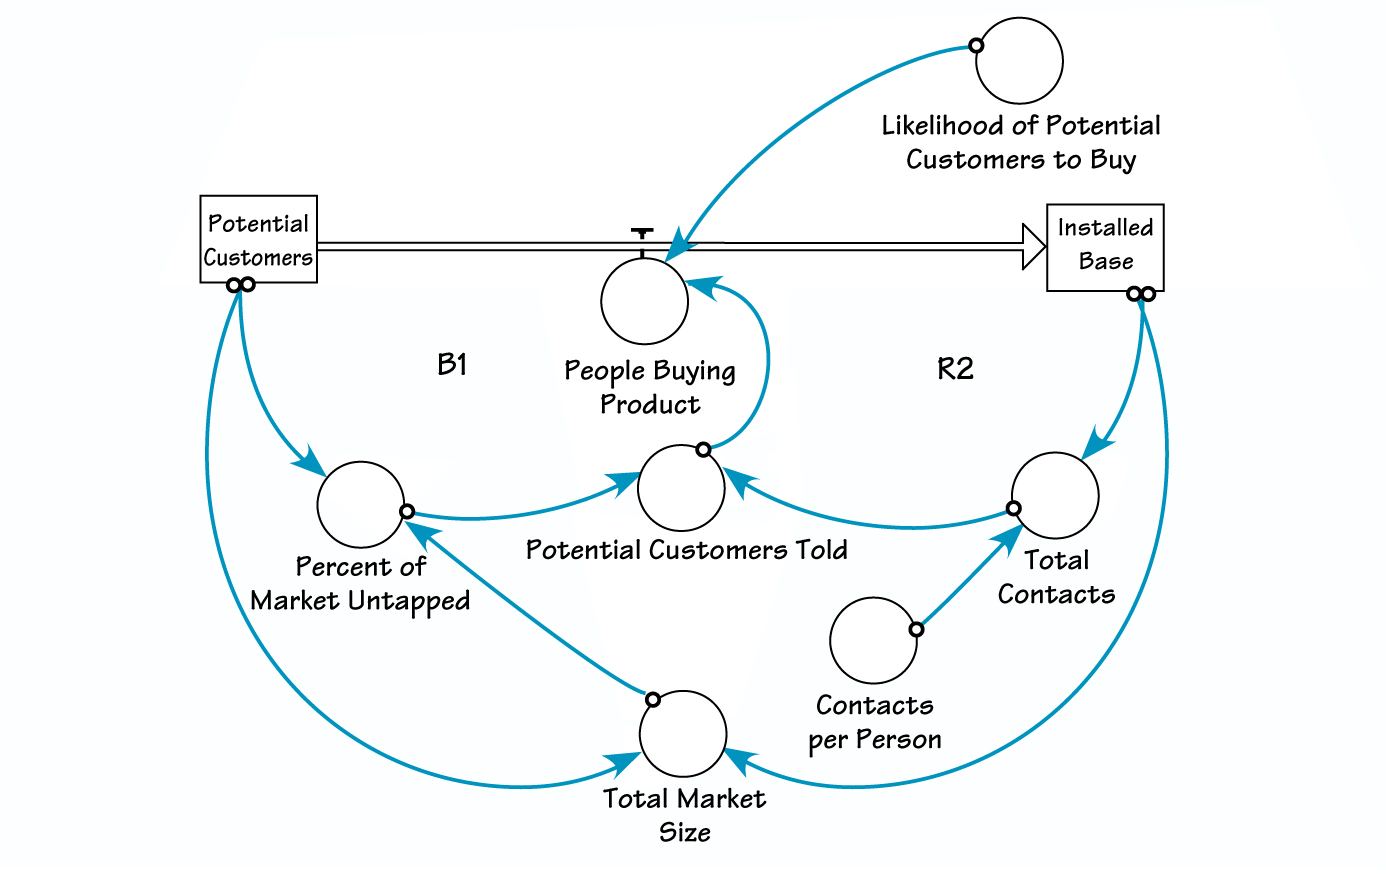
Once you have defined all necessary variables and made all units consistent, you have completed the conversion of the CLD to a stock and flow diagram. However, the model still is not calculable. Consider the calculation for People Buying Product: What number of Potential Customers Told about the product buy the product in an average month? Without knowing this figure, you cannot calculate the value of the flow People Buying Product. What is missing is the percentage of people told about the product who decide to buy it, which we will call Likelihood of Potential Customers to Buy. With this variable included, if we know the value of Potential Customers Told, we can calculate the number of People Buying Product.
THE FIRST ITERATION
THE FINAL VERSION
CONVERING CLDS TO STOCKS AND FLOWS
- Specify the Units of All CLD Variables. Begin by asking yourself the question, “What are the units of each variable in the diagram?”
- Identify and Create the Stocks. Follow the guidelines in Part 1 of this series (in the May issue of THE SYSTEMS THINKER) to determine which CLD variables are stocks.
- . Identify and Create the Flows. Once you have identified the stocks, it is easy to identify the flows: They are the variables that add to or subtract from the stocks
- Connect Flows to Stocks and Stocks to Flows (if Necessary). First, connect all flows to the stocks that they influence. Then, if a stock influences one or more flows, connect the stock to the flows through an information link.
- Add and Link Remaining CLD Variables. Add any CLD variables that you did not identify as stocks or flows. These “auxiliary” variables are either constants or calculations based on stocks and flows. Connect the new variables as necessary
- Define Stocks and Flows and Check Units. Specify the equations that allow you to calculate the value of each variable when you know its initial value and the value of the other variables in the diagram.
- Create and Link Any Additional Variables. Defining the variables may lead you to discover additional variables necessary to complete the conversion process and make the model calculable.
As it turns out, however, we can’t calculate the number of Potential Customers Told per month because we don’t know how many people each member of the Installed Base tells. Without that information, we can’t figure out how many potential customers are told about the product. If we add a new variable called Contacts per Person, then we can determine the number of Potential Customers Told (the Total Contacts made by the people in the Installed Base, multiplied by the Percent of Market Untapped). Using that figure and the Likelihood of Potential Customers to Buy, we can calculate the number of People Buying Product. At this point, the diagram is calculable and the conversion is complete (see “The Final Version”).
The Learning Process
Just following a conversion “recipe” is insufficient for learning to create stock and flow diagrams. For that reason, we recommend that learners work through a series of conversions (for examples, see the Web address at the end of the article), starting with simple ones and moving on to more complex ones facilitated by an instructor before attempting solo or paired conversions.
Daniel Aronson (aronson@thinking.net) holds an MBA from the MIT Sloan School of Management. He recently joined Arthur Andersen’s Knowledge Services Business Solutions Team and is the host of the Thinking Page (www.thinking.net). Daniel Angelakis (dangelakis@aol.com) is a senior consultant at Arthur Andersen’s Knowledge Services Business Solutions Team. For additional examples and more detail on the conversion process, go to www.thinking.net/Systems Thinking/ stocksandflows.html.