The systems thinking community has always considered stock and flow diagrams to be important tools, and recognition of their key place in the systems thinker’s toolkit has continued to grow. However, despite their importance, difficulty in moving from causal loop diagrams (CLDs)—which most people learn first—to stock and flow diagrams has contributed to limiting their use.
Although the difficulties that some people have when trying to make the transition from causal loop diagrams to stock and flow diagrams are real, they are also largely avoidable. Following a specific series of steps, students can learn how to create stocks and flows from causal loops quickly and efficiently. When we used a step-by-step approach as part of a two-day course with learners who had little or no prior background in systems thinking, 90 percent were able to turn a causal loop diagram into a stock and flow diagram correctly in only 20 minutes. In addition, they found that the rigor and completeness of their understanding had increased significantly over what it had been when they had used only causal loops.
Overview of Stocks and Flows
Stocks and flows are the foundation of system dynamics modeling. But how exactly do they work? Stocks are entities that can accumulate or be depleted, such as a bathtub, which fills with water from a faucet. Inventory and Installed Base are examples of stocks. Flows, on the other hand, are entities that make stocks increase or decrease, like a faucet or drain affects the level of water in a bathtub. Production (which increases Inventory) and Purchases by Consumers (which increases Installed Base) are examples of flows. Note that flows are the only variables that can change stocks.
The presence of a flow indicates the movement of material; for example, the flow of inventory, cash, and so on. A useful rule of thumb is that, because flows capture activity, all of the things that you find on income and cash-flow statements (such as cost of goods sold, interest expense) are flows; these items represent financial activity during a specific period. In contrast, all of the line items that you find on a balance sheet (such as assets and liabilities) are stocks; these items represent financial status at any point in time.
A technique commonly used to distinguish a stock from a flow is to consider what would happen in the system if time were to stop. Stocks, which are accumulations, would continue to exist. Flows, how-ever, would disappear, because they are actions. For example, at any given moment, inventory, the balance in your savings account, and the people in a conference room are measurable and, therefore, are stocks; they would continue to exist if time were to stop. On the other hand, the manufacturing rate of units per hour, the bank’s interest payment per day, and the movement of people in and out of a conference room would halt, because they are dependent on time. These are flows (see “Stocks Versus Flows” on p. 7).
Finally, at all times, it is important to maintain unit consistency between a stock and the flows that affect it. Consider, for example, a stock that represents the balance in your company’s bank account in units of dollars. This stock cannot have PC Manufacturing Rate as an inflow, because its units are PCs per week! Instead, an acceptable inflow would be Payments from Customers, which would be in units of dollars per month.
{page 6 pdf334 image1}
Differences Between CLDs and Stock and Flow Diagrams
Causal loop and stock and flow diagrams are both valuable tools, but they are fundamentally different. CLDs are useful for communicating high-level views of a system, especially to people who have little background in systems thinking or system dynamics. They are easily understandable and can provide a good first step for the systemic analysis of a problem.
Stocks and flows take the analysis to a higher level of rigor. Unlike CLDs, stock and flow diagrams differentiate between the parts of the system. They also typically include more detail s about the elements of the system than do CLDs—for example additional variables not represented in a CLD.
Thus, becoming proficient in creating both CLDs and stock and flow diagrams provides several advantages over using CLDs alone:
Stock and flow diagrams distinguish between variables that are stocks and those that are flows, while CLDs do not. Because there is a fundamental difference between these kinds of variables, distinguishing between them produces an enhanced understanding of the system.
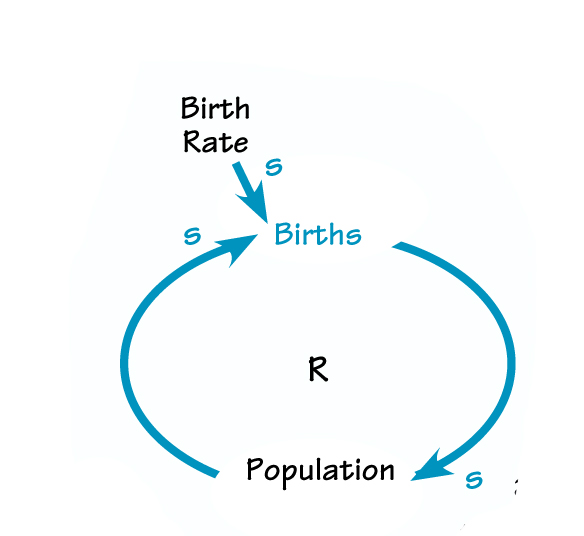
For example, consider the simple reinforcing loop of Births and Population. Because Births is a flow (representing the rate of increase in Population), and Population is a stock, a CLD does not represent this system as accurately as does a stock and flow diagram. In the CLD, both links in this loop are “s” links, indicating that as Births increase, Population increases (a change in the same direction), and as Population increases, Births increase (another change in the same direction).
However, this representation is not completely accurate. If Birth Rate declines, causing Births to decrease, say from 1000 to 900 per month, Population does not in turn decrease; it continues to increase, only at a slower rate than before. Thus the “s” link from Births to Population is accurate only when Births is increasing, because Births and Population do not move in the same direction when Births decrease.
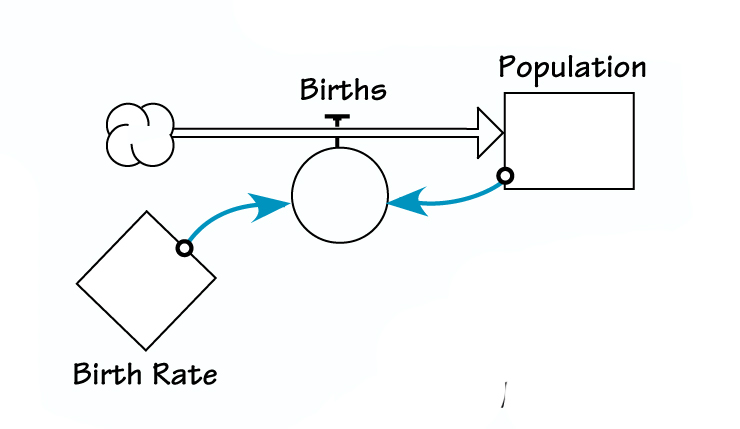
In contrast, a stock and flow diagram makes it visually apparent that Births is an inflow to Population and thus can only increase it, not decrease it (because there cannot be a negative number of births). This distinction between stocks and flows makes stock and flow diagrams a more accurate rendition of the system being represented.
Stock and flow diagrams force you to develop a more subtle view of the system. Another advantage of stock and flow diagrams is that they require you to specify important details about the system, such as the units and relative magnitudes of all variables.
This has three benefits:
- It forces you to think about each variable in more detail to determine what its units of measure should be.
- It makes you think more specifically about the relationships between the variables in order to check that the units combine properly.
- It pushes you to discover overlooked variables that are necessary to make the units of the diagram match. The combination of these benefits results ina more detailed, stronger understanding of the system than can be gained from a CLD.
Stock and flow diagrams help you take the next step toward creating a computer model of the system.Because system dynamics modeling packages use stocks and flows as their fundamental language, creating a stock and flow diagram makes it much easier to build a computer model of the system you are studying. In addition, the level of detail required for a good stock and flow diagram helps you specify the system with the exactness required by a computer model. Transforming a CLD allows you to experiment with different policies and discover counterintuitive dynamics
Connecting CLDs and Stock and Flow Diagrams
You now have a basic knowledge of stocks and flows and of how they can be useful. In the next article, we will introduce a step-by-step process for converting CLDs to stock and flow diagrams. These steps provide a strong foundation for understanding the connections between CLDs and stock and flow diagrams. Learning to use stock and flow diagrams will make your thinking more complete, more precise, and more easily turned into a computer simulation—all of which will help you gain a better understanding of whatever system interests you.
STOCKS VERSUS FLOWS