Read the business media today and you’ll see that organizations of all types, from all sectors, are in deep trouble. There are many reasons for this organizational crisis – and many excuses for the poor performance that organizations are delivering. However, the thread present in all organizations that are experiencing this dynamic is that managers aren’t aligned in a common view of where the business is, where it is going, how it should get there, and how they can contribute. This lack of alignment leads to reactive thinking and less-than-optimal outcomes.
Fortunately, the problem isn’t insurmountable; in fact, it is resolved quite easily – if senior managers commit to working together to have a better understanding of where the organization is today and where it is going. This article introduces four different tools – the Vehicle Analogy, the Fire-Fighting Matrix, the Vision Deployment Matrix, and the Conceptual Framework – that can be used in tandem. The first two are diagnostic tools, designed to surface people’s perceptions of the organization’s current reality and future potential as well as to expose barriers to success. The second two provide frameworks for identifying a shared vision of a desired future and outlining steps for achieving that goal. By utilizing these four tools together, a management team can create an environment that can help their organization realize its potential.
From X to Z Through Y
All organizations are on a journey from a current reality (“X”) to a desired future (“Z”). That desired future might be to attain a specific set of goals, such as a certain market share or earnings. It might also be a series of milestones that would signal to stockholders that the company’s management is the right team to continue to run the company. The road from X to Z contains a series of initiatives and targets along the way, symbolized by the letter “Y.”
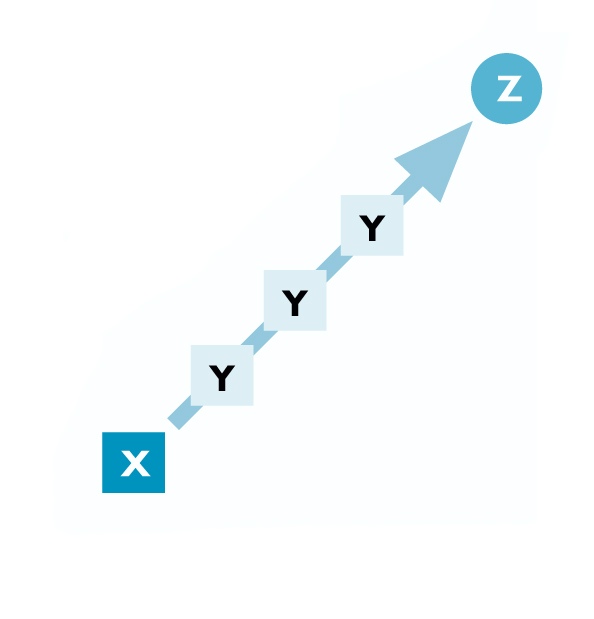
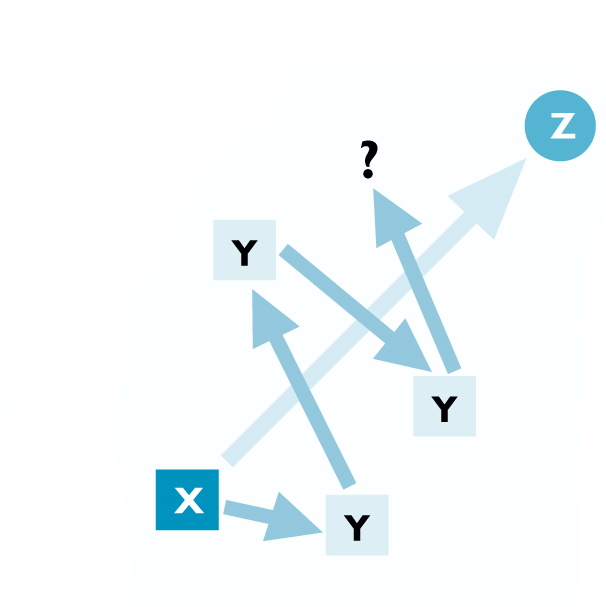
Here’s the problem. On the surface, the best route to get from X to Z is a straight line. And in business, a straight line means a clear, concise, understandable path of activities. However, in many organizations, the path from X to Z begins to wander a bit. Instead of going directly from X to Z through the Ys, managers find that the Ys have suddenly shifted and are no longer on the direct route to Z. And too often, the overwhelming number of Ys causes workers to lose sight of how to get to Z, or even where Z is.
This dynamic – losing sight of Z – is even more complicated when some managers see different and conflicting Ys. An even worse scenario is when people begin to believe that getting to a particular Y carries the same importance and focus as getting to Z.
So how can an organization maintain a common understanding of what Z is, where it is, how to get there, and why it is so important? The solution is to make sure that everyone in the organization – from the senior management team right on down to the evening shift workers – knows the answers to these questions at any given time. Equally important is to make sure that they have a clear picture of how they fit and how their work activities contribute to reaching Z. The first step to creating this focus is to ensure that everyone has a common understanding of the company’s current situation, or “X.”
Surfacing Current Perceptions
The good news about understanding the current situation in an organization is that there is a plethora of data available: competitive analyses, revenue projections and forecasts, globalization trends, workforce shifts, inventory turns, asset valuations and utilization, productivity effectiveness, and so on. The bad news is that hardly any of the data available looks at people’s mental models of the organization. Most of us agree that employees are the most important asset of any organization; therefore, knowing how they view the business, its potential, and their role in reaching organizational goals is critical.
Getting people to articulate their view of the organization can be difficult. Workers’ reluctance to be open with their perceptions often stems from the fear of possible retribution from management, the fear that they are alone in their view, or just an inability to articulate their observations and feelings. One way to get past these obstacles is to have employees compare the organization to a type of vehicle. Using the vehicle analogy creates a non-threatening environment in which people can discuss their views of the organization creatively and descriptively.
This process usually works best with groups that represent a cross-section of the company to provide representative thinking across the organization as a whole. Once you have your group together, ask these four questions:
- If our organization were some kind of vehicle, what kind would it be?
- What is the condition of that vehicle?
- What part of the vehicle are you? (You cannot be a driver or passenger, but must be an integral part of the vehicle itself.)
- What kind of vehicle will the organization be in three years (or whatever time range you are interested in)?
In question number 1, you are looking for the year, brand, model, and color of whatever type of vehicle the participant chooses. Participants usually select automobiles, but they could also pick bicycles, boats, airplanes, trucks, rockets, or whatever. The only criterion is that the vehicle must be something that was manufactured, which precludes using animals such as camels or horses.
In question number 2, you are seeking a detailed description of how the participants evaluate the current condition of the vehicle, such as rusted, dented, cleaned on a regular basis, or receives regular maintenance. This question surfaces perceptions about the organization’s health and its ability to realize its potential.
Question 3 is meant to get participants to think about how they contribute to the organization’s functioning. The role people play is too often confused with their job title or description. After they respond with something like “the fuel,”, “the carburetor,” or “the windshield,” the facilitator can surface additional mental models by asking, “And what function does that component perform in the vehicle? What would make it operate more effectively?”
Question 4 is used to identify what participants believe the organization will be able to achieve in the timeframe selected. Sometimes people report quite a change from the current vehicle (question 1) to the future vehicle (question 4) – the Wright Brother’s plane to a space shuttle; a skateboard to a new BMW. Equally, we have seen almost imperceptible shifts between the current and the future – a 1985 Ford Taurus to a 1985 Ford Taurus with new paint, a 2001 Mercedes Benz to a 2002 Mercedes Benz. On occasion, we have even seen the analogy seem to go backward – a 1999 Volvo wagon to a 1996 Volvo sedan.
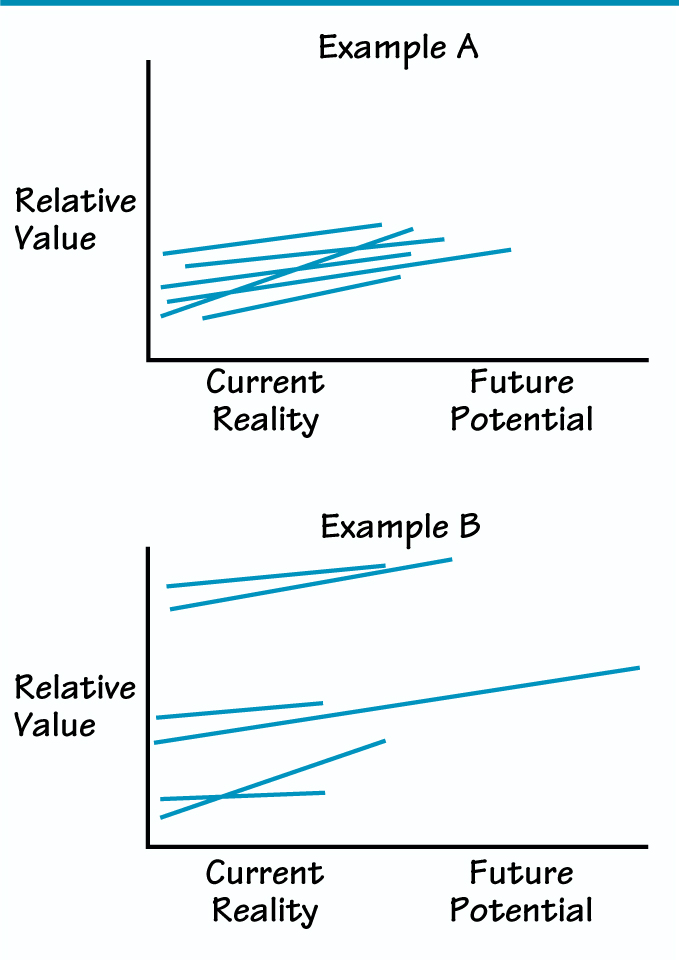
This exercise helps to surface people’s assumptions about the organization and highlights any gaps in alignment among the perceptions of different participants. To show these discrepancies, the facilitator plots the results from questions 1 and 4 from all participants on a graph (see “Vehicle Graphs”).
For each individual, the results will be a straight line between two points, one for “current reality” and one for “future potential.” If the person’s assessment is that the company is currently an old bare-bones Volkswagen Beetle but has the potential to become a next-generation space shuttle, then the line will start at the bottom left corner and travel up to the top right. If the individual thinks the company is a middle-of-the-road performer now and will remain so in the future, a short, horizontal line would appear halfway up the graph.
The plotting is relative. So if one person characterizes current reality as a VW Beetle, but everyone else says its a pogo stick, then the VW plot line would start at a higher point than the pogo-stick plot line. An old car today that in three years will be the same car but clean would result in a horizontal line that doesn’t go very far to the right; again, the actual positioning would be based on the other answers.
The responses in example A represent an organization with a good level of alignment in the perceptions of current reality and future potential. The responses shown in Example B appear to be quite scattered, that is, participants had little common understanding of where the organization is and where it is going.
VEHICLE GRAPHS
Conversation about the graphs centers on the following questions:
- What does this graph tell us about our alignment around our current reality and future potential?
- What is the impact of these assumptions on our ability to deliver consistently high performance?
- What level of alignment do we need?
- What do we want to do about it?
So, if most of the people view the future organization as a sturdy Toyota Camry but a few others see it as a jalopy, the group has a common language for exploring why their opinions diverge so dramatically. From this foundation, they can begin to create a common understanding of what their expectations are, where they want their organization to go, and what they will need to do to get their organization there.
The Curse of Fire-Fighting
Unfortunately, many organizations spend too much time on their journey to Z fighting fires. This may seem counterintuitive. Most certainly, if there is a crisis, it must be resolved. The problem comes when people put out the same fires year after year. The key to high performance over time is to extinguish fires and then make sure that they stay out. Doing so requires a different set of mental models about handling critical organizational problems than most managers have today.
In order to break the cycle of fire-fighting, we first must have a clear picture of how much of it is really happening. The best way to accomplish this is to have each member of a group plot on a four-block matrix how much and what kind of fire-fighting he or she thinks is taking place in the organization (department, team, etc.) (see “Fire-Fighting Matrix”). Participants use circles to represent current activities and squares to represent activities at some point in the past. A facilitator then combines all the data on one matrix.
FIRE-FIGHTING MATRIX
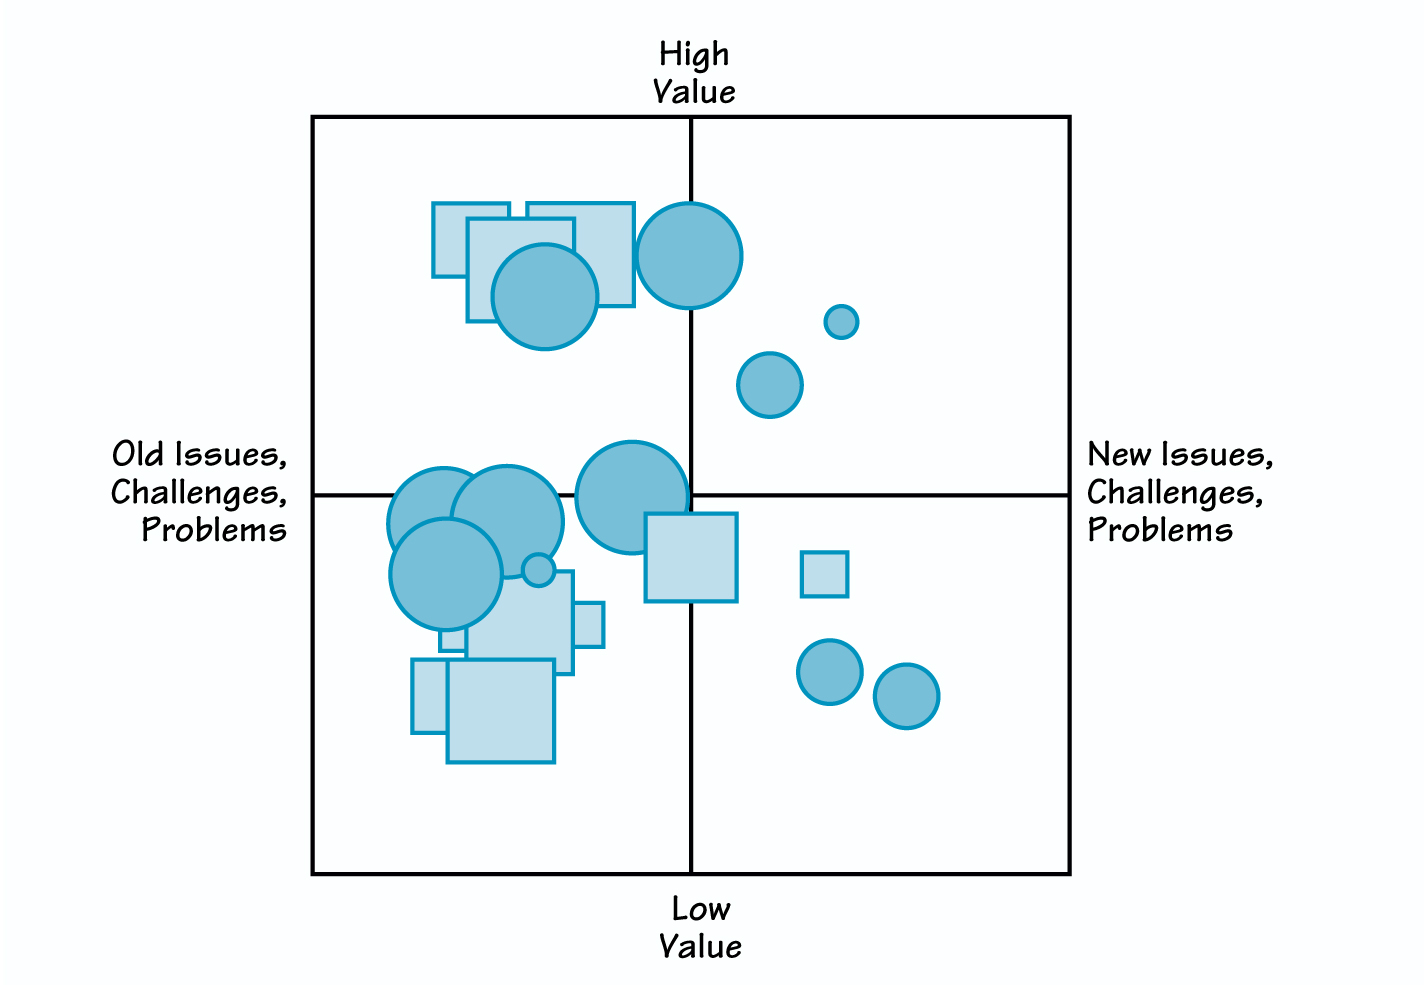
In this example, people believe little learning has happened in the organization. This is demonstrated by the fact that, for the most part, the circles (today’s fire-fighting) are in the same area as the squares (fire-fighting two years ago). If learning were taking place, the circles would mainly appear in the upper-right quadrant of “new and high-value” problems.
The composite matrix often shows that people believe little learning has happened in the organization. This is demonstrated by the fact that, for the most part, the circles (today’s fire-fighting) are in the same area as the squares (fire-fighting two years ago). If learning were taking place, the circles would mainly appear in the upper-right quadrant of “new and high-value” problems. The fact that learning is not taking place means that the organization will continue to relive the same problems year after year, lessening its ability to realize its potential over time.
The vehicle analogy and the fire-fighting matrix are complementary diagnostic tools. In a company in which there is a distinctly low set of expectations (as shown by the vehicle analogy exercise), you generally find high levels of fire-fighting – fighting the same fires over and over again. By using the vehicle analogy and the fire-fighting matrix together, managers and employees can begin to see the impact of their collective actions. This is the first step to shifting behaviors and removing the roadblocks to organizational success.
ChemCo (a pseudonym), a global organization from the chemical sector, recently used these two tools. The management team and their direct reports were closely aligned in their perceptions of where the organization was and where they thought it would be in the future. However, their expectations about what the company would accomplish were rather bleak. Likewise, the output from the fire-fighting matrix showed that the company was not learning from experience. In organizations, perceptions are as important as reality. At ChemCo, the belief by managers and workers alike that the company had little possibility to realize its potential threatened to become a self-fulfilling prophecy.
Through this analysis, participants should have a good idea as to why the organization might struggle on its journey to Z. To overcome these barriers, they need to create a common vision of a desired future, with a detailed list of the actions that will support it. The next two tools – the Vision Deployment Matrix and the conceptual framework – can help an organization do just that.
Understanding Z
We usually describe Z – the organization’s overall goal – in terms of what we might call “events.” Events are the organizational outputs that are most easy to see and, consequently, most often measured. They are typically variables such as revenues, market share, headcount, and stock price. For energy companies, the list probably includes barrels per day; for healthcare facilities, the number of patients discharged; for manufacturing, production levels; and for service organizations, customer service ratings. These are fine measures, but they represent a rather myopic view of Z.
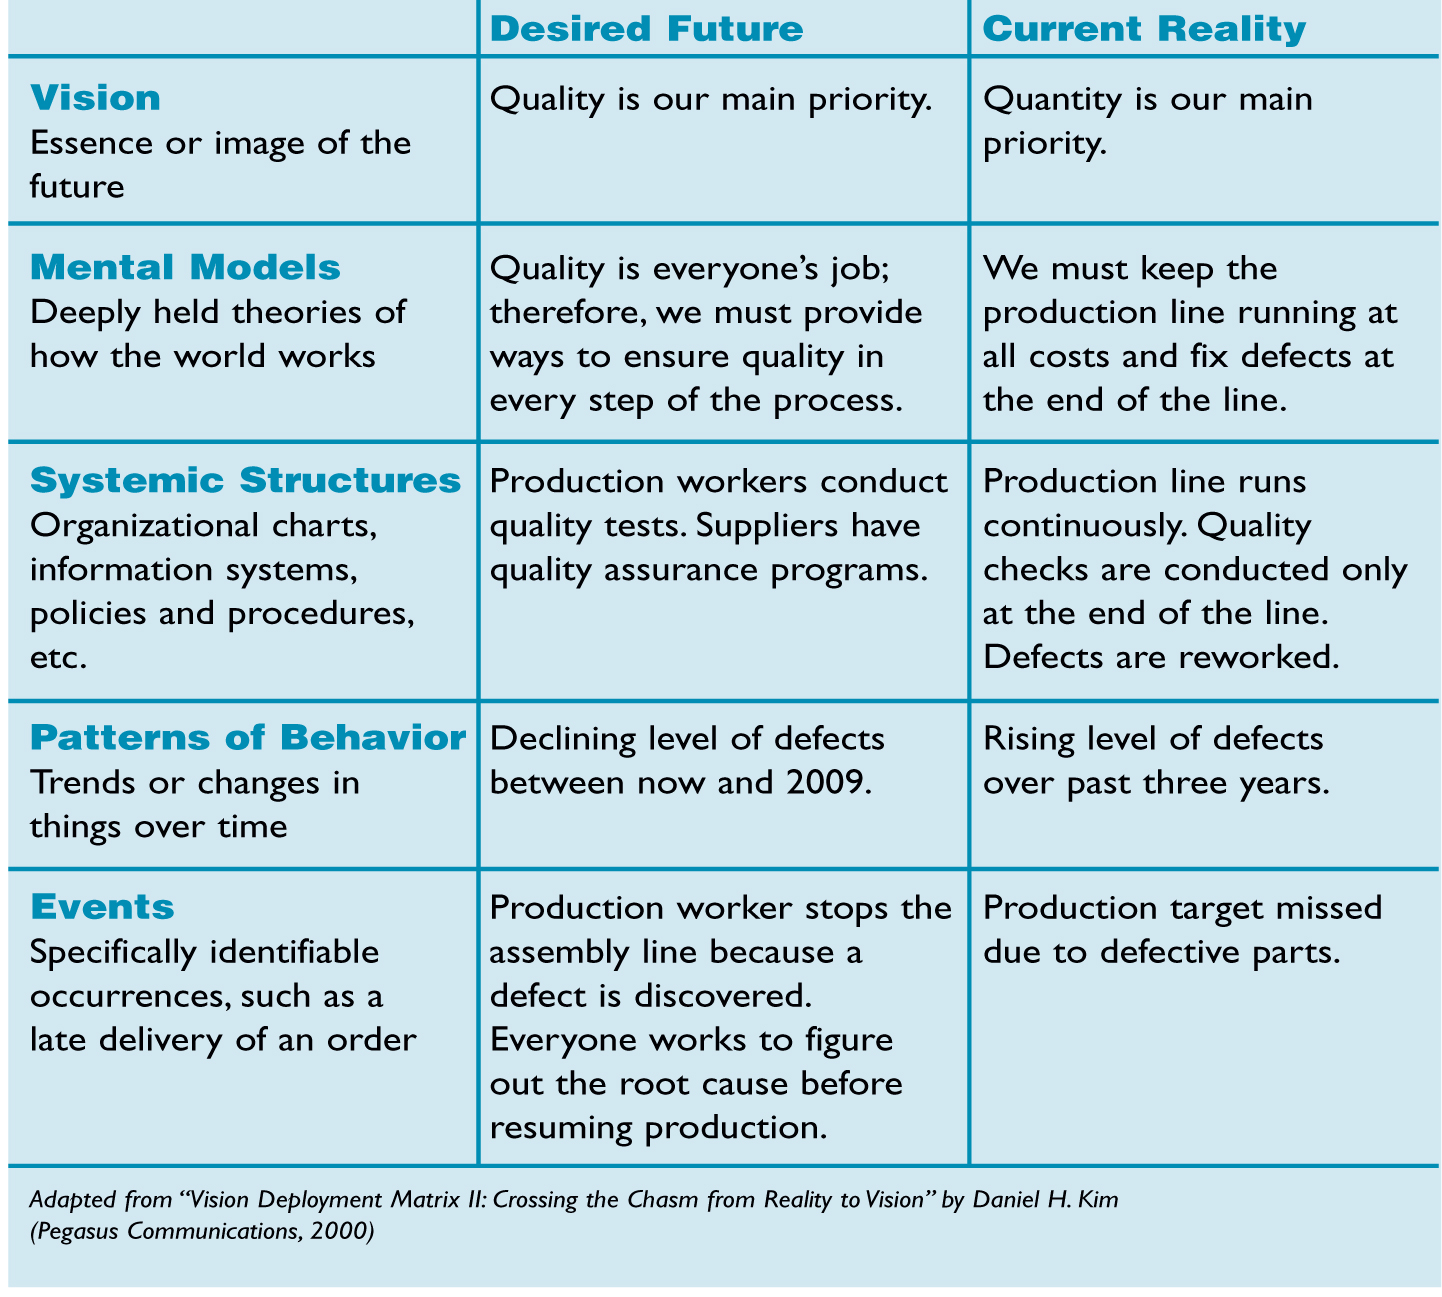
To get a true picture of Z, it is important to be able to describe not only the events, but also the patterns of behavior that lead to certain actions; the systemic structures (both the explicit and implicit policies and procedures) that will support the process; and the mental models of the managers and employees necessary for achieving the goal. The Vision Deployment Matrix is useful for compiling this detailed view of Z.
The Vision Deployment Matrix™ (VDM) is a tool designed by Daniel H. Kim to enable managers and employees to describe the organization’s current reality as well as what they want the organization to look like in the future (see “Vision Deployment Matrix”). By describing these two points in the journey in detail, the path from current reality to desired future becomes clearer – and more achievable. The difference between the vehicle analogy and the VDM is that the vehicle analogy paints a picture of people’s general impressions of the organization today and what they think it will become; the VDM offers a detailed look at the organization now, as well as specifying what employees want it to be in the future
Each participant fills out a matrix, and the results are then compiled. For ChemCo, there was a startling difference between what the ChemCo managers expected to happen, as shown in the vehicle analogy, and what they wanted to happen, as shown in the VDM. This gap is a serious problem, because it means that the organization as a whole lacks the confidence to reach Z.
To help bridge the gap, the group must come to agreement on a common vision, the steps for achieving it, and progress indicators to make sure they are on the right track. At the same time, individuals list action items for how they can contribute to the overall process. Because the VDM includes not just actions at the event level but also at the pattern, structures, and mental models levels, the actions people take are likely to be more effective than when they were operating only at the event level. By using the VDM, employees gain confidence that the organization is working toward a common goal and that it is achievable, regardless of past experiences.
Evaluating Individual Progress
Especially for managers, the process of closing the gap between the organization’s current reality and desired future means changing how they think, how they influence others, how they achieve goals and targets, and how they lead. To help draw attention to each of these areas and evaluate progress, the conceptual framework can be useful.
VISION DEPLOYMENT MATRIX
The conceptual framework has four columns labeled “thinking,” “influencing,”, “achieving,” and “leading.” These leadership competencies are critical for an organization to be able to reach its potential. The rows are labeled with company values, specific initiatives, organization-wide goals, key competencies, or other variables that are important to the particular organization (see “Conceptual Framework”).
To complete the framework, managers fill the cells of the matrix with the demonstrable behaviors they will need to exhibit in order to make progress in those areas. This exercise can be particularly challenging for leaders who are used to focusing on “achieving” at the expense of the other competencies. After the managers fill in their frameworks, they present what they have written down to the others in their group. After the presentations, participants then commit to what they will do differently in support of each item in the framework; that is, how they will change their behavior in ways that will be visible to others.
A management team at ChemCo did this exercise together. One month later, the team met to evaluate their progress. The facilitator had prepared an assessment for the group. Each manager read the list of commitments for the other members and evaluated whether they saw no evidence of change, some evidence of change, or a clear difference in the manager’s behavior. The assessment documents were then collected and compiled, with the compiled data presented in aggregate form for each manager.
At this first assessment meeting, both individual and team scores were largely unchanged. The team was disappointed by their lack of progress, but realized that, without this data, they wouldn’t have known how well they were doing in achieving their goals. The assessment gave them the motivation to continue to focus on improving their performance.
CONCEPTUAL FRAMEWORK
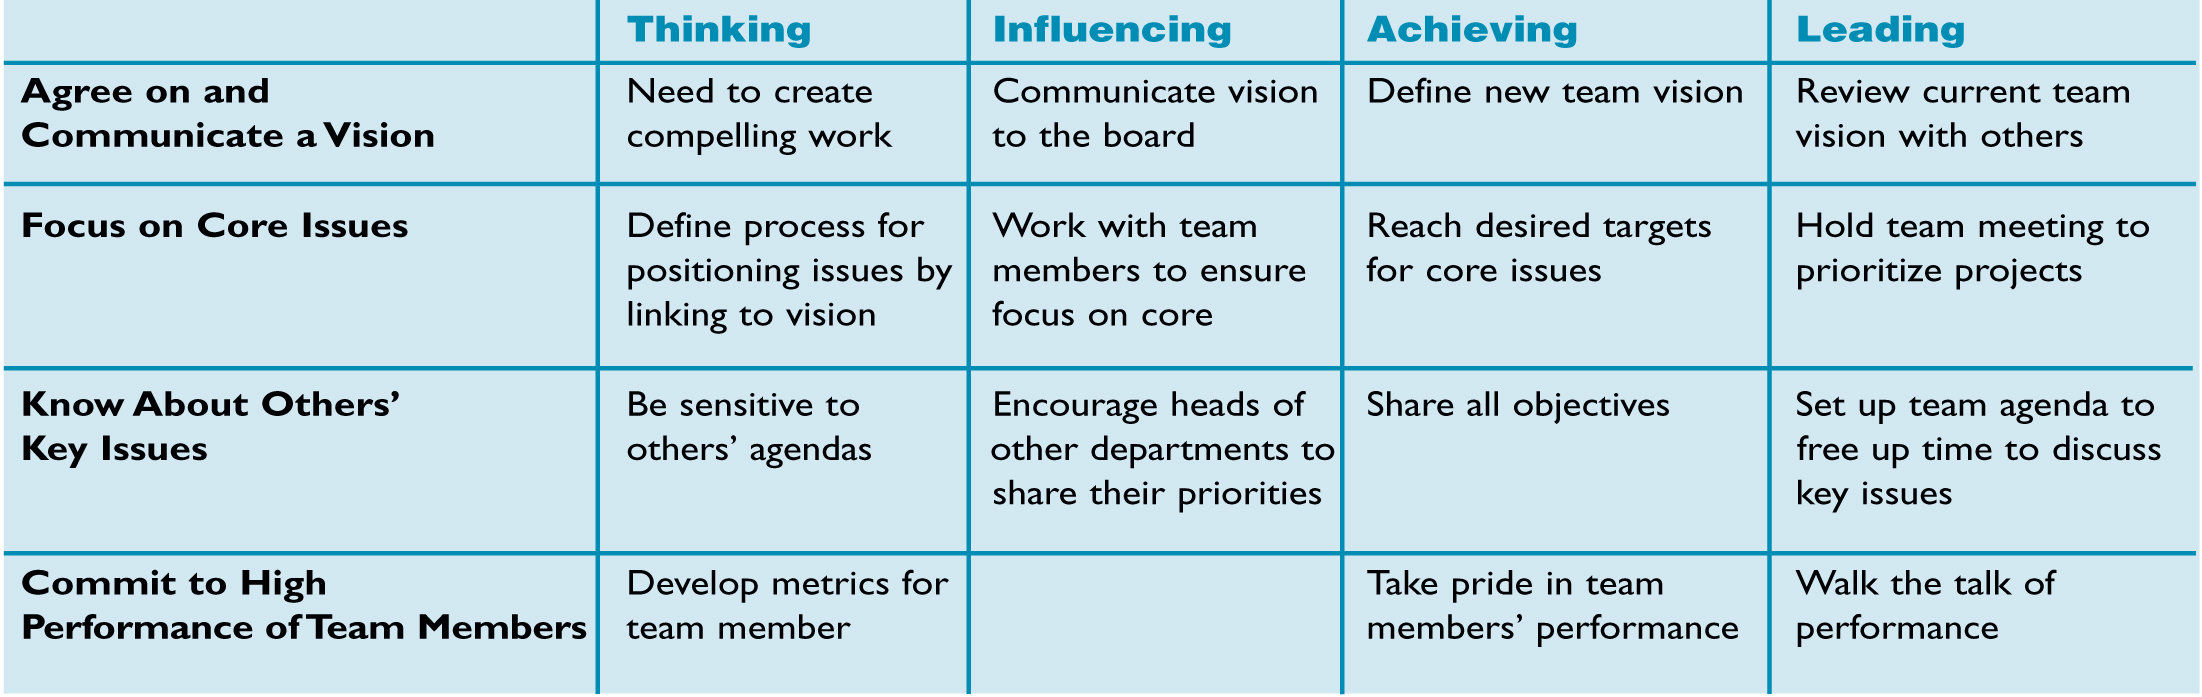
Managers fill out the cells of the matrix with the demonstrable behaviors they will need to exhibit in order to make progress in those areas. They then identify what they will do differently in support of each item in the framework; that is, how they will change their behavior in ways that will be visible to others.
One team member asked, “How often do you think we should do this assessment?” Another wanted to know, “Can we use this assessment with our own teams as well as with this team?” Both questions showed that managers were beginning to think in a different way than they had in the past. They saw the value of the exercise and wanted to be assessed not only by their peers but also by their subordinates. This is a sign of a senior leadership team that was serious about both getting better at being leaders and staying on a positive course on their journey to Z.
Bridging the Gap
Most managers lack clarity about their organizations’ visions and aspirations. Just because an organization has a printed vision statement doesn’t mean that people know what it means. Too often, the vision statement is just a set of cleverly worded phrases that tell of a glorious organizational future without giving workers a sense of how they fit into creating that future. If managers and employees don’t see the connection between what they do on a daily basis and where the organization is going, they will not be able to ensure that the company gets there.
These four tools, in combination, help people make the connection between current reality and desired future, and provide concrete ways to bridge the gap. They are not meant as simply opportunities for participants to vent or whine about why their companies are having problems. Rather they provide an opportunity to elevate the conversations about why the organization is where it is and where it is going. The tools also help to create an environment in which an organization can realize its potential. And that is what the journey to Z is all about.
NEXT STEPS
- Evaluate where your organization is on the “road to Z.” Is the destination clear to everyone in the organization, or are there disagreements – spoken or unspoken – about where the organization is going and how you’re going to get there?
- If you think your group, department, or organization would benefit from the framework presented in this article, come up with a plan for working through each of the exercises as a group, perhaps at a working retreat or series of strategy meetings.
- If you think your organization needs help but isn’t ready to commit to the entire process, you may start by introducing the vehicle analogy. If people see the disparate views that individuals hold of the organization and its future potential, they may want to find ways to create alignment by using the other tools introduced in this article.
– Janice Molloy
James B. Rieley (jbrieley@boardrush.com) is a leadership development advisor for senior management and their teams. He has a doctorate in organizational effectiveness and has written extensively on the subject of improving organizational performance. He is the author of Gaming the System (FT/Prentice Hall, 2001) and Plain Talk about Business Performance (PenPress, 2004).