How well do you know your local area? Most people rely on a bewildering thicket of newspaper articles, TV news, and radio programs that paint fragmented pictures of their community — often vividly accentuating its most negative features. To give citizens, government, businesses, and community groups an accurate sense of how things are going so they can make informed decisions about the future, an institution in Boston, Massachusetts, has set out to develop a comprehensive set of indicators, using data to create common ground.
History of the Indicators Project
The Boston Indicators Project was conceived in 1997 by the Boston Foundation and the City of Boston, in partnership with the Metropolitan Area Planning Council and other public agencies, local universities, and community organizations. In large and small gatherings that eventually involved over a thousand residents, experts, and leaders, the Project created a framework of objectives and indicators of progress that reflect shared community values. The Project’s first report, The Wisdom of Our Choices: Boston’s Indicators of Change, Progress and Sustainability, was released in 2000 with goals and measures in 10 sectors: civic health; cultural life and the arts; economy; education; environment; housing; public health; public safety; technology; and transportation. These 10 sectors encompassed 71 indicators and 150 measures. Scheduled to continue until 2030, with an updated report due every two years, the Project is designed to stimulate long-term thinking, creative goal setting, and collaborative action.
While it was intuitively obvious that the variables measured by the indicators in the 2000 report were interrelated, the Indicators team was seeking a way to communicate the interrelationships across sectors, the ways they were connected, and how strong the connections were. To address these challenges, the group’s first step was to work with two students in Jim Hines’s system dynamics class at MIT, Brendan Miller and Osamu Uehara, during the 2001 spring semester to construct causal loop diagrams and computer models showing important relationships across several key areas.
That summer, Miller worked with the team at the Boston Foundation, led by Charlotte Kahn and Geeta Pradhan, to develop an introduction to systems thinking for sector experts, civic and community leaders, and activist residents. After several pilot sessions with presentations of hard-to-read “spaghetti diagrams” and broad abstractions, the team decided to stop trying to explicitly teach systems thinking. Instead, they facilitated participants’ direct experience of systems thinking through:
- Identifying trends shaping the region, using intuitive behavior-overtime graphs;
- Identifying the probable drivers behind the trends;
- Depicting connections visually, using causal loop diagramming; and
- Brainstorming high-leverage strategies to affect the trend drivers based on the systems structure the group explored during this process.
This approach proved highly successful and was used in small groups at a major civic convening of 400 participants. The next step was a two day scenario-planning workshop with a diverse group of 60 participants sponsored and facilitated by the Waitt Family Foundation. There, participants identified key trends and their secondary and tertiary implications, creating a clear sense of possible futures for the metropolitan Boston region.
Still, the goal of incorporating systems thinking into the next Boston Indicators Report remained a challenge. In the spring of 2002, the Project team began to work with two local systems thinkers, Dan Aronson and Phil Clawson. The team identified its goals as:
- Creating ways to identify and communicate connections across indicators;
- Weaving the results into a coherent story, emphasizing patterns of relationships across sectors based on hard data; and
- Telling the story in a compelling way to stimulate greater understanding of the usefulness of the Boston Indicators Project and the power of a systems approach to analysis and community problem solving.
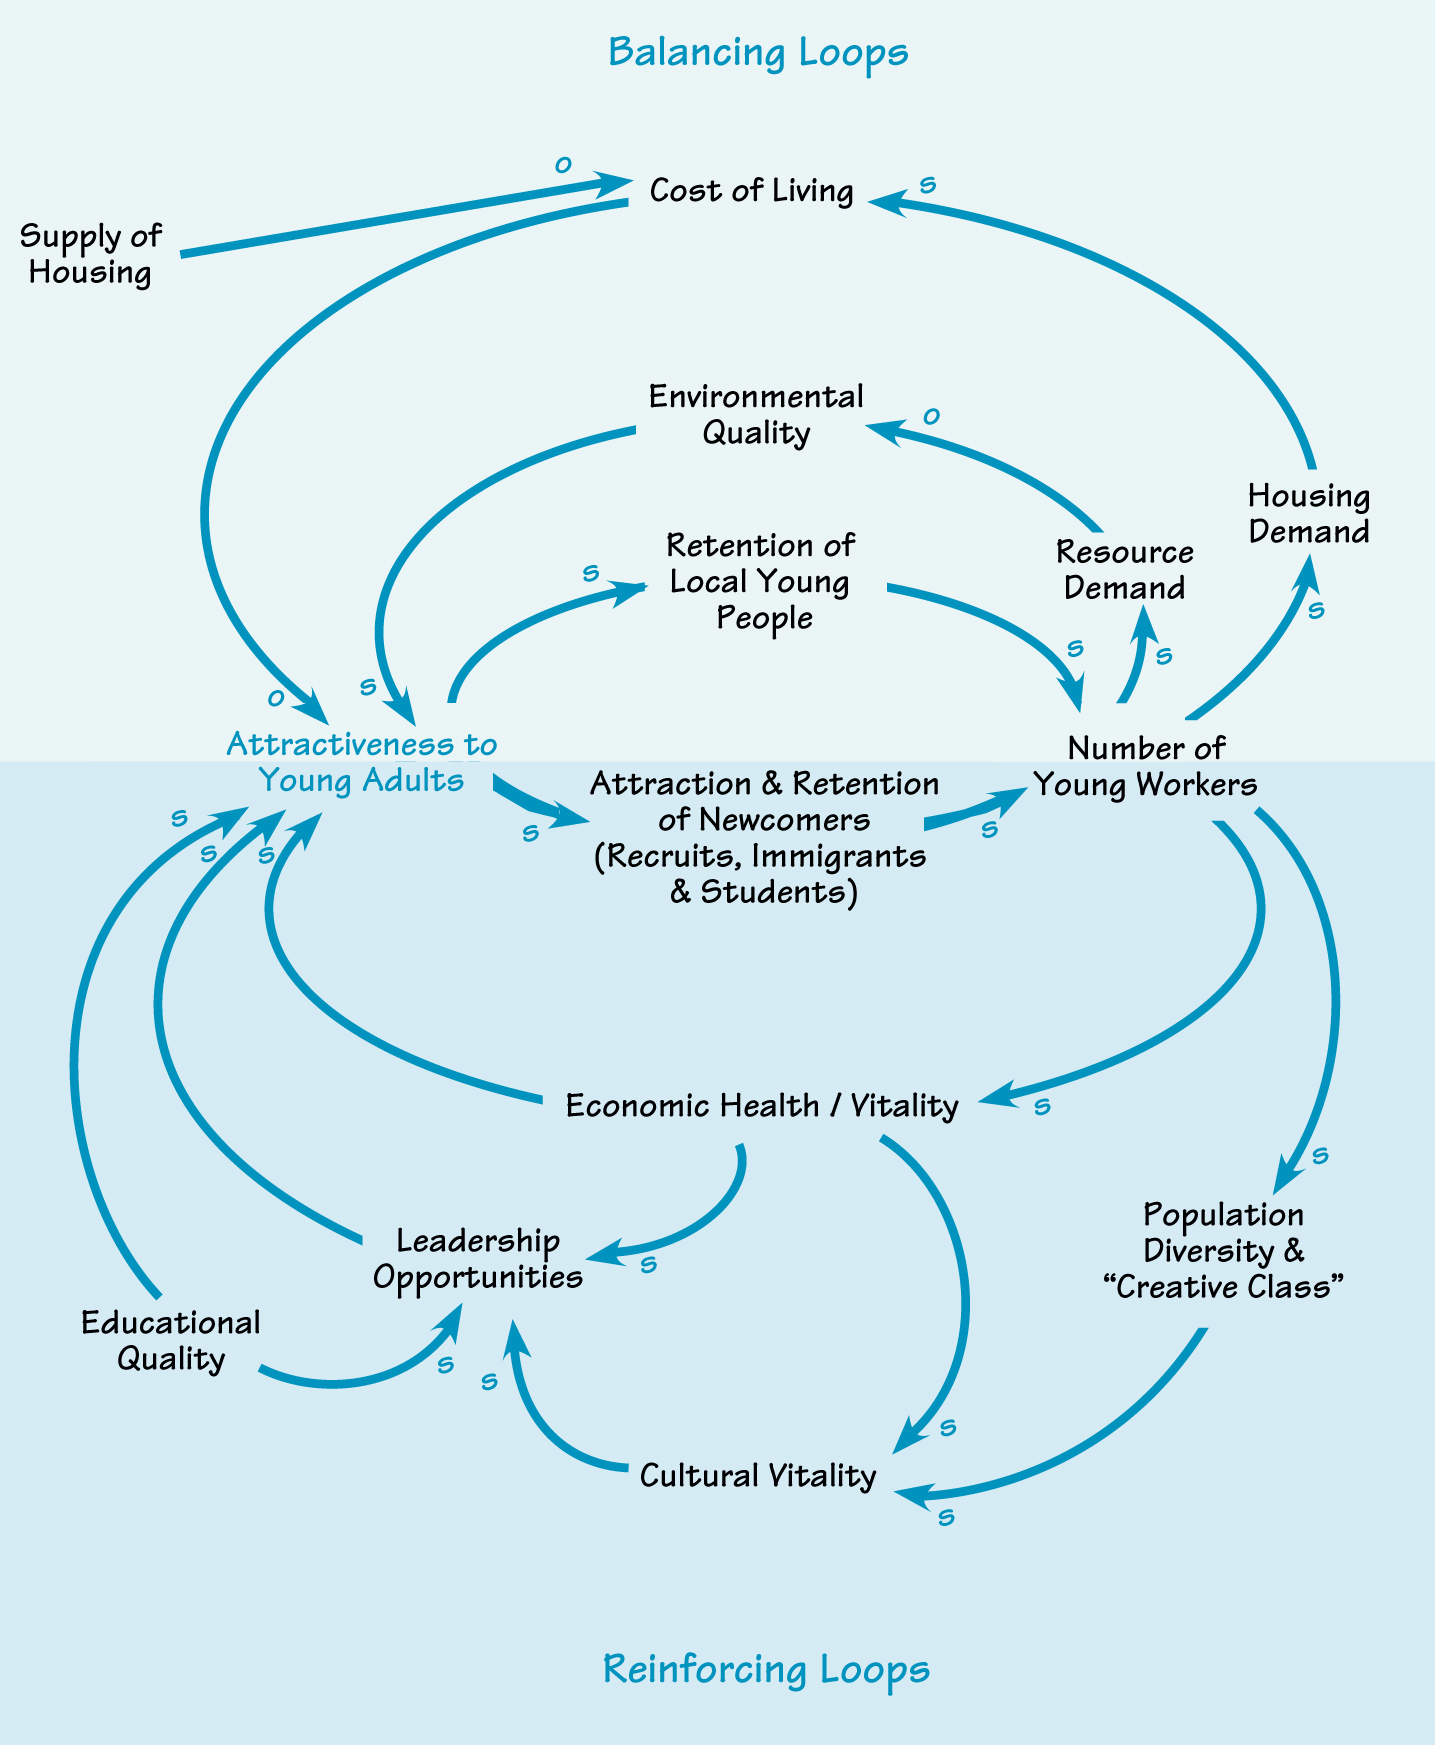
FACTORS AFFECTING BOSTON’S ATTRACTIVENESS
Weaving a Coherent Story
The team approached issues facing Boston from many angles (e.g., economic, social, and environmental) and at different levels (e.g., a high-level picture of the forces shaping the region as well as more detailed pictures of particular sectors). With the help of Dan and Phil, they created causal loop diagrams for each level. For example, “Factors Affecting Boston’s Attractiveness” shows, at a high level, some of the reinforcing and balancing loops driven by residents’ decisions to remain in or leave the region. During this process, the team built on the work of the scenario-planning workshop participants, who had pinpointed certain trends. For example, in exploring data showing the outflow of young people from the Boston area, the team connected an economic issue (the high cost of living driven by housing costs) and a socio-political one (the dearth of minority representation among the region’s business and elected leadership) as two key factors in “stay/leave” decisions made by young adults in Greater Boston.
Eventually, a core set of issues emerged that began to tell a connected story of where Greater Boston is headed economically, culturally, socially, and environmentally. The story describes a key asset in the region: innovation. What Metro Boston lacks in oil, coal, or cornfields it makes up for in intellectual and financial capital. As the birthplace of innovations ranging from the first public library to the first digital computer, Boston’s role as a hotbed of innovation can be traced to three sources: a strong institutional and physical infrastructure, a culture and practice of innovation, and high-quality human capital. The combination of these factors gives Boston its competitive edge and has helped the city reinvent its physical and social landscape and its economy many times in response to emerging challenges and opportunities.
The team then identified the loss of human capital — in particular, a drop-off in the number of young adult workers — as a challenge to sustaining the area’s success in producing innovation. Between 1990 and 2000, Boston, the metro region, and Massachusetts lost a greater percentage of a critically important age cohort — 20 to 34-year-olds — than their high-tech counterparts elsewhere in the country. This trend does not bode well for economic growth in an innovation economy.
The report has stimulated dialogue about how to keep Greater Boston attractive as well as how to preserve its competitive edge by lowering the cost of housing, promoting more diverse leadership structures, and supporting a livable, culturally vital environment.
The team asked the question: Why did Greater Boston lose this human capital, even during the boom economy of the 1990s? Part of the answer, the team surmised, is that young people with aspirations, innovative ideas, and marketable talents and skills have many options for where to live — and, for some reason, they are choosing to live and work elsewhere. But why? The team focused on factors that had emerged in the project’s earlier convenings, such as the scenario-planning workshops, that might be influencing the decisions of young people. These included Boston’s high cost of living relative to salaries, driven by dramatically rising housing costs; its traditionally limited opportunities for emerging leaders in business and electoral politics, particularly new leaders of color and women; and its cultural vitality, educational quality, and environmental amenities (including the weather). The Indicators Project had also found that the population of young people had grown in comparable regions between 1990 and 2000. For instance, regions such as Austin, Raleigh-Durham, and Seattle had increased their share of young people, presumably because of their greater attractiveness along these dimensions.
Looking to the Future
The final 2002 Indicators Report intentionally did not make recommendations about how to change the conditions that threaten to deplete Greater Boston of its innovators; instead, it identified key areas that local leaders need to address in order to reverse the trends. As a result, the report has stimulated dialogue about how to keep Greater Boston attractive to homegrown talent, newcomers, and recruits as well as how to preserve its competitive edge by lowering the cost of housing, promoting more diverse leadership structures, and supporting a livable, culturally vital environment that appeals to talented young workers, emerging leaders, the “creative class,” and innovators.
In a way, the Boston Indicators Project was the perfect type of project for a facilitated systems thinking process. The task of making a complex system understandable and enabling stakeholders to identify key issues was well suited to the strengths of the discipline.
In 2004, the next edition of the Boston Indicators Report will be released. It will include not only facts and trends but a description of a high-leverage civic agenda shaped by the Project’s growing number of participants. The systemic perspective now embedded in the Project will help to lay the groundwork for a constructive outcomes-oriented dialogue. Systems thinking will be used to identify key leverage points and practical, powerful, systemic strategies for shared civic action.
The Boston Foundation’s Boston Indicators Report 2002, Creativity and Innovation: A Bridge to the Future, is now available as an interactive, searchable web site at www.bostonindicators.org.
Daniel Aronson (daronson@fourprofit.com) is managing director of Four Profit Inc. (www.fourprofit.com), a consulting firm helping organizations improve all four bottom lines: financial, people, environment, and community.
Charlotte Kahn is the director of the Boston Community Building Network. Geeta Pradhan is the director of the New Economy Initiative at the Boston Foundation. Together, they coordinated the Boston Indicators Project and coauthored the Boston Indicators Reports 2000 and 2002.
Phil Clawson is the managing director of Community Matters Group (www.communitymattersgroup.com), a consulting firm that helps organizations maximize the good they can do in their communities while returning real value.
Brendan Miller (bmiller@meristemgroup.org) is a partner with the Meristem Group, providing leadership and systems thinking training and consultation to organizations from around the globe working for the public interest.